Published on , by Matt Stiles, May 26th 2012, 7:57:44 pm
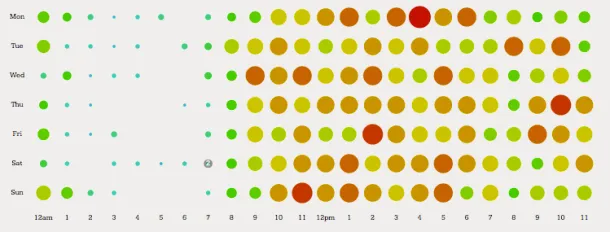
I’ve posted more than 3,700 tweets since early 2009, when I began archiving my data. This chart, made with Raphaël JS, shows which days and times were most common (see the interactive version):