How Far Above (Or Below) .500 Did Each MLB Team Finish This Season?
I live in South Korea, where it isn't always easy to watch American baseball (unless you're a fan of the Los Angeles Dodgers or the Texas Rangers). So I'm catching up with data.
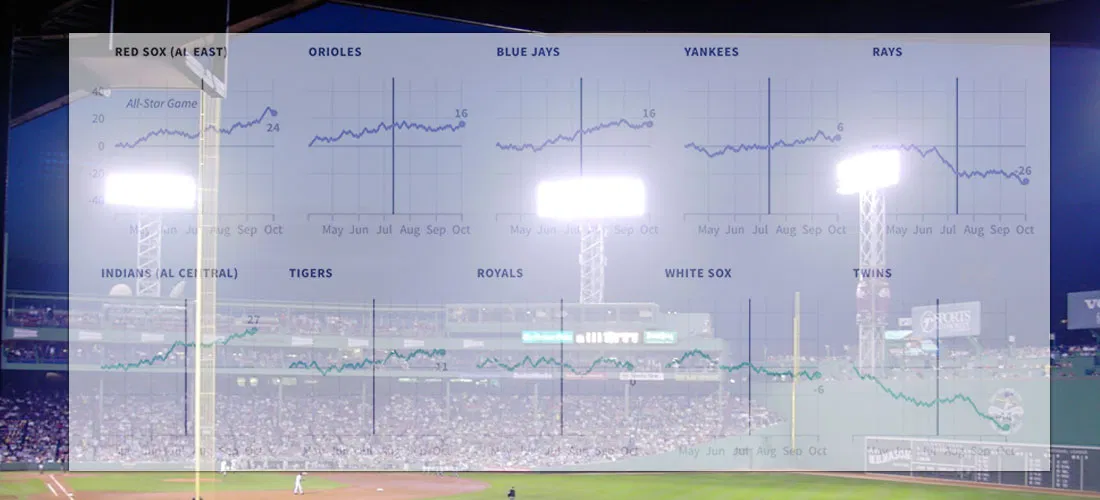
These charts show teams' performance by tracking how many games above (or below) .500 they moved as the season progressed. The Chicago Cubs did best (45 games over), while the Minnesota Twins did the worst (-44 games). The Royals, on the other hand, finished right where they started: .500.
Thank you again, @nprviz, for your super dailygraphics rig — and your inspiring examples.