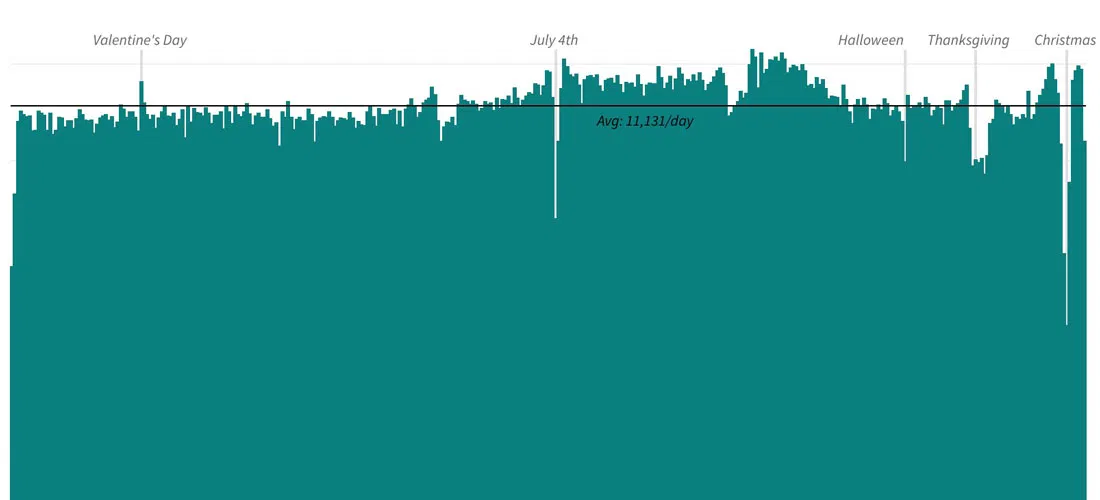
Charting American Birthdays: Yours Probably Isn't That Special
Last week I published a new heatmap exploring the popularity of American birthdays. The chart, which uses darker shades to represent higher average birth counts on specific days, can give the impression that some birthdays are much more common than others.
In reality, outside of some special o...
Read more →

How Common is Your Birthday? This Visualization Might Surprise You
It's baby season in America, with September the busiest month for births on average in the last two decades. So it seemed like the right time to remix this blog's most-popular post: How Common is Your Birthday?
That old heatmap, which highlighted specific dates for popularity, has been viewed m...
Read more →
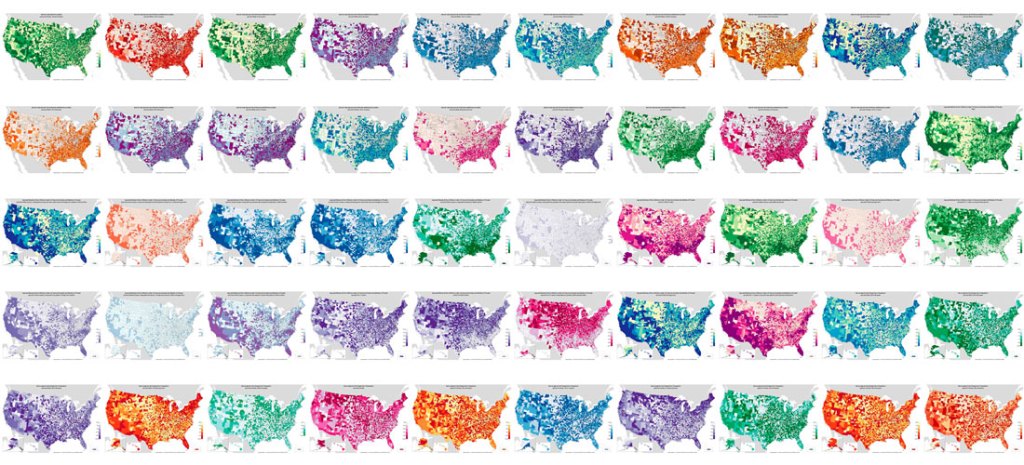
A Random Generator of Random @mapmakerbot Maps
One of my favorite Twitter bot ideas is @mapmakerbot, which visualizes American demographic data each hour in the form of county-level maps. You can read the technical details here.
The bot, created by New York artist Neil Freeman, has posted thousands of maps this year. Some are interesting. O...
Read more →
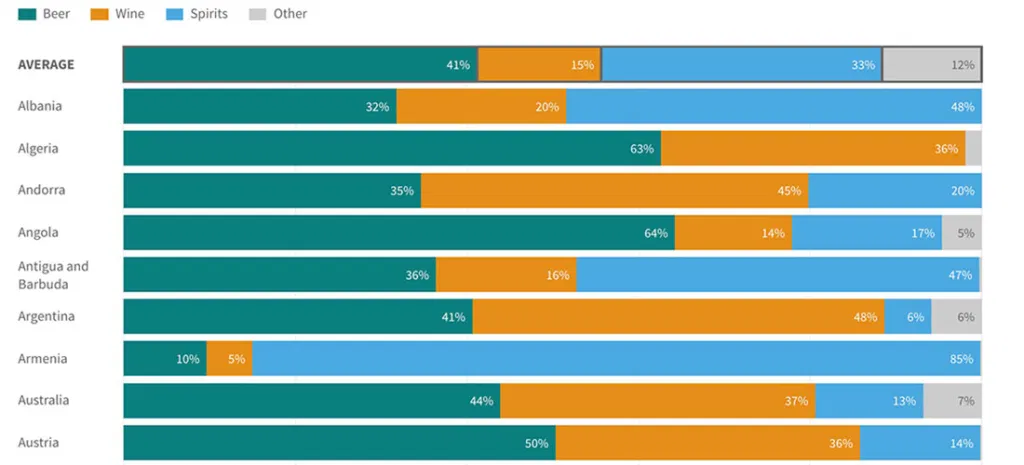
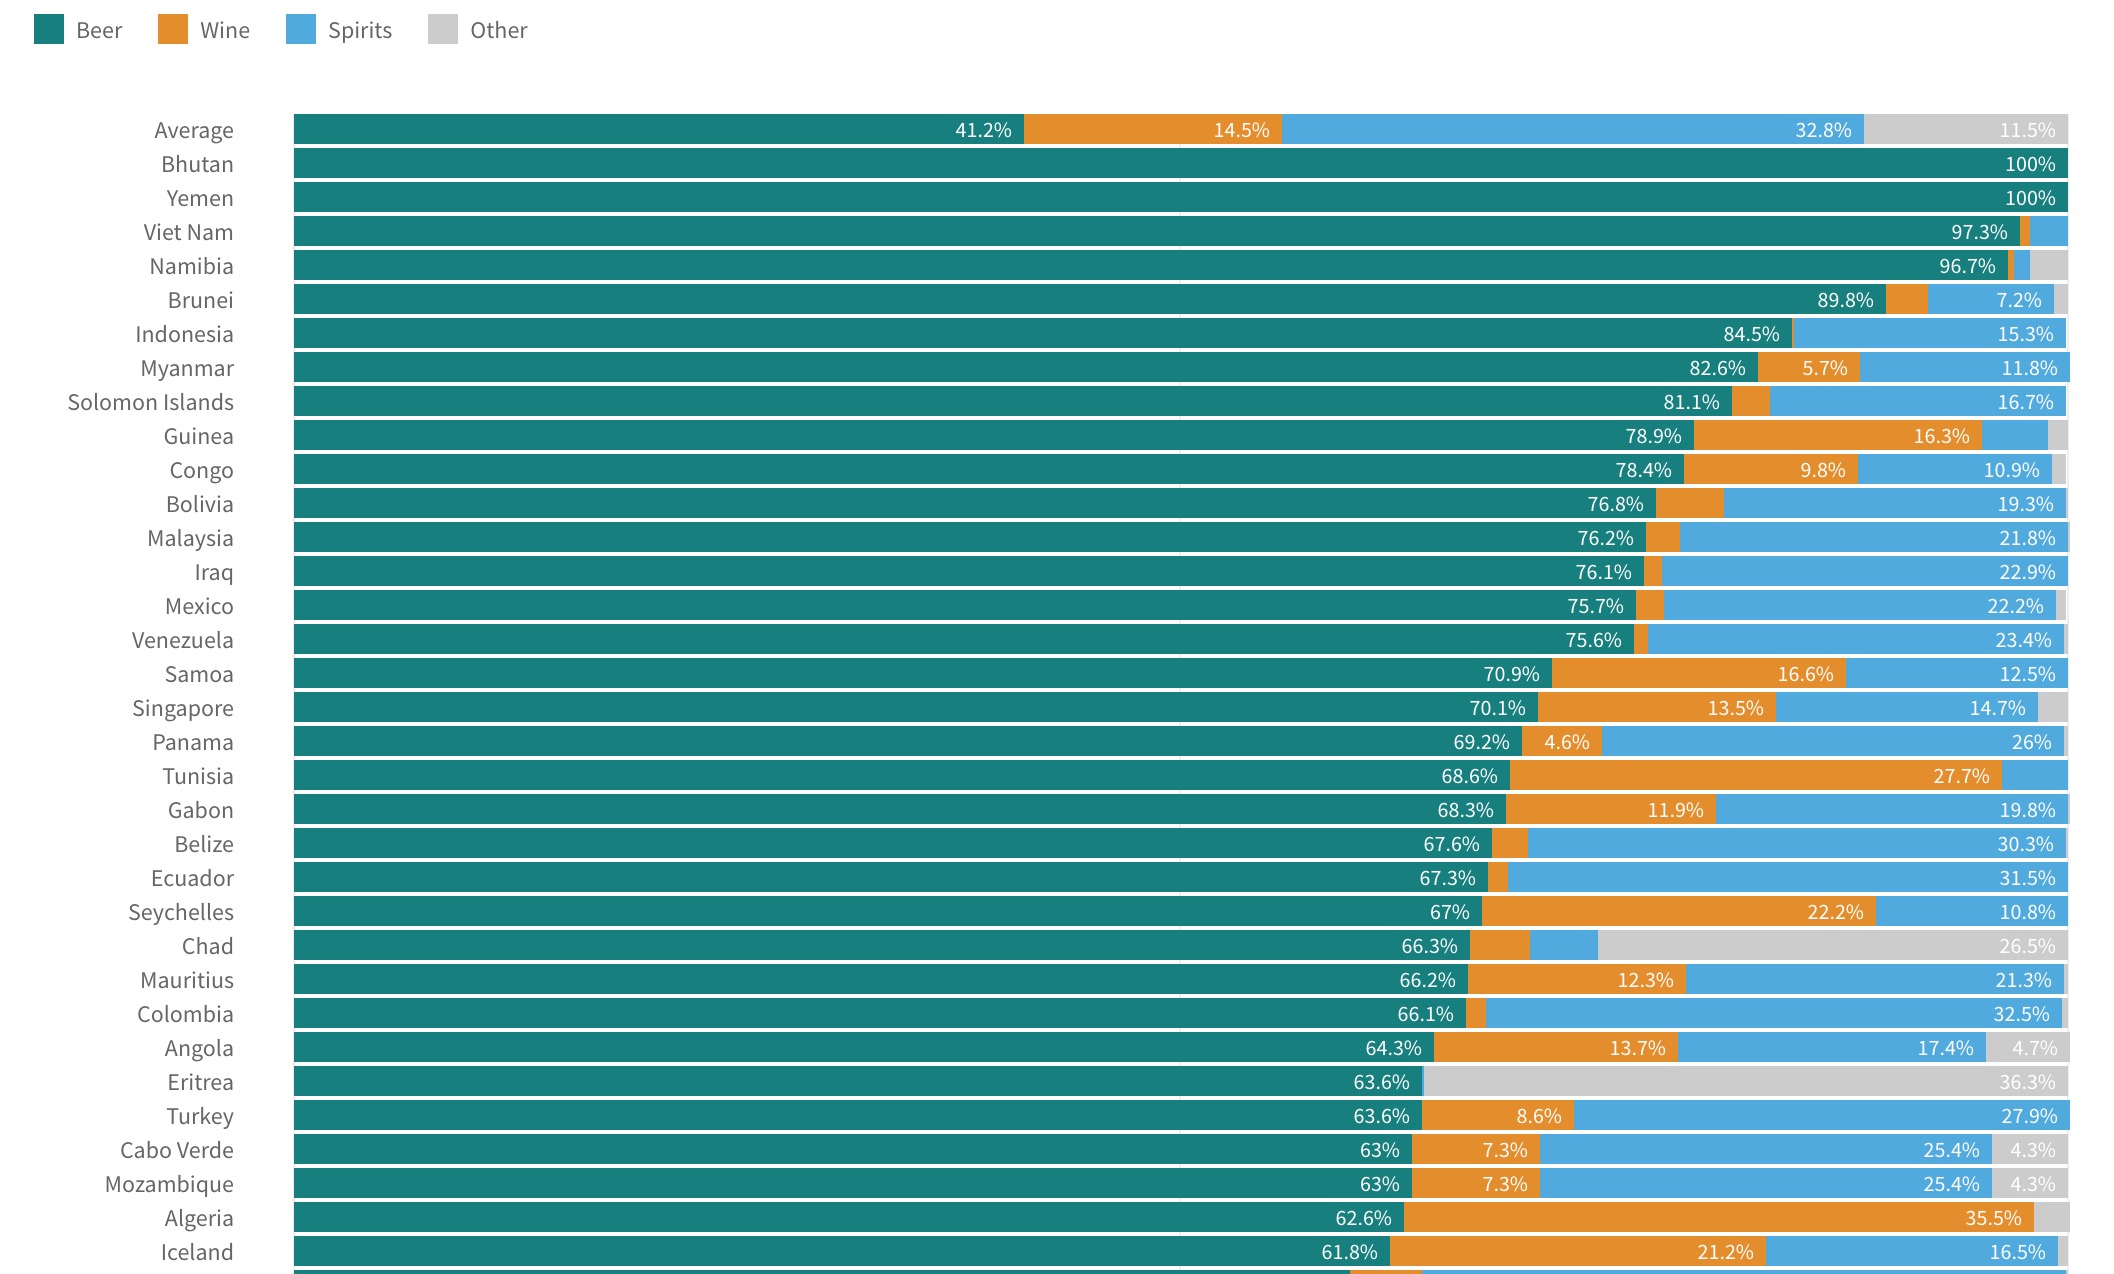
Visualizing World Alcohol Consumption: What Beverages Do Countries Prefer?
I posted recently about how countries consume different amounts of alcohol — and how some have wider gender gaps when it comes to booze.
The previous posts relied on two data sets from the World Health Organization, which calculates consumption (in liters and grams) based on surveys and actual...
Read more →
Visualizing World Alcohol Consumption: How Much Does Each Country Drink?
A few weeks ago I posted about gender gaps in alcohol consumption around the world.
In some countries — South Korea, for example — men and women consume quite different amounts of booze, according to the World Health Organization. Fueled by a love for soju, South Korea's men are among the heav...
Read more →

Mapping D.C. Building Heights
I posted yesterday about residential buildings in Seoul and South Korea. Here's a quick look at the buildings in my previous city, Washington, D.C. Darker shades represent taller buildings:
Read more →
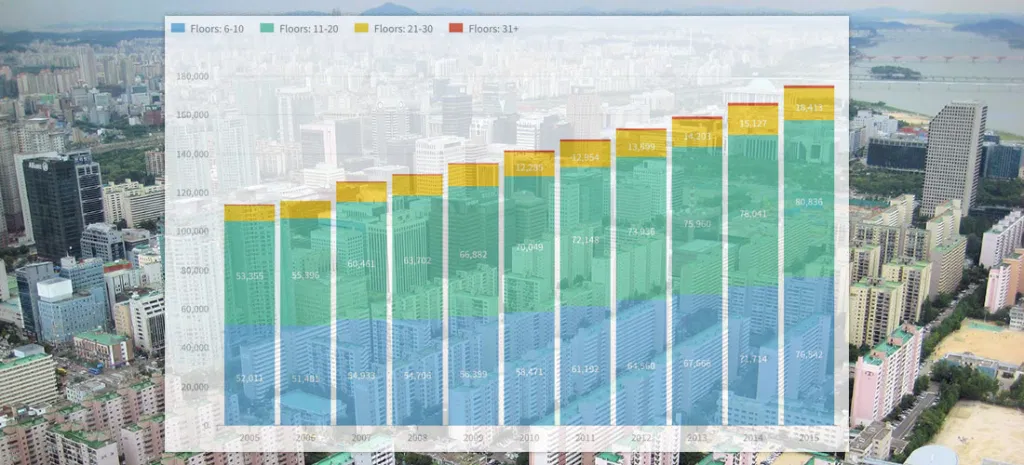
South Korea's (Residential) Rise: How Building Heights, Home Sizes Vary
Note: I followed my wife, a foreign correspondent for NPR News, to Seoul last year. This is one of a series of posts exploring our adopted country's demographics, politics and other nerdy data stuff. Let me know if you have ideas for future posts.
I never lived in a high-rise building before m...
Read more →
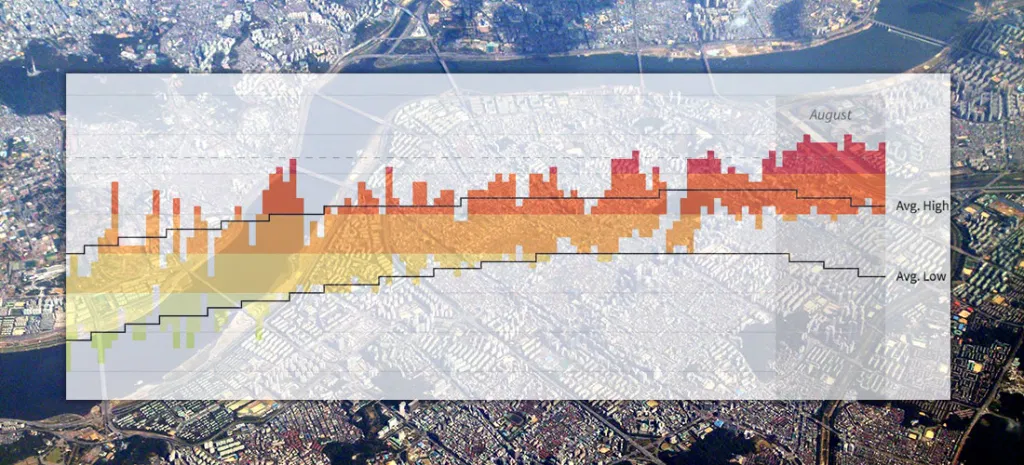
Seoul's Steamy Summer (Updated)
Note: I followed my wife, a foreign correspondent for NPR News, to Seoul last year. This is one of a series of posts exploring our adopted country's demographics, politics and other nerdy data stuff. Let me know if you have ideas for future posts.
I've been away from Seoul for much of the summ...
Read more →
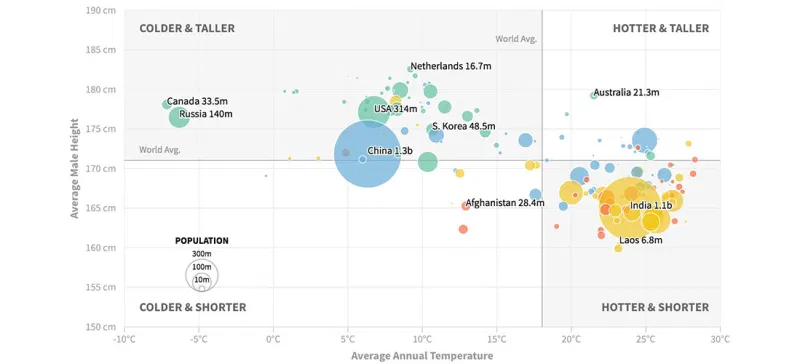
Are People in Colder Countries Taller? (Continued...)
Earlier this week I posted two scatterplots examining the relationship between a country's average temperature and its male residents' average height. The data show some correlation, but there probably are several of other factors affecting height as well.
The earlier plots shaded the country d...
Read more →
Are People in Colder Countries Taller?
I got married in Amsterdam. One thing I remember most about my time in The Netherlands is the obvious height of the locals. Both men and women, generally, are quite tall.
A new study supports my anecdotal observation. Dutch men are the tallest people in the world (women there are second), foll...
Read more →