Posts tagged "Google Earth"
Testing ai2html on a North Korean Defector
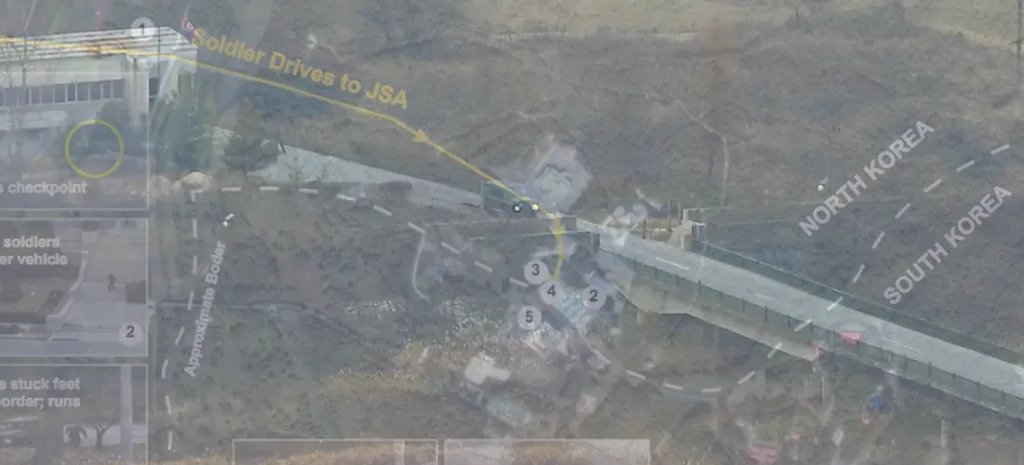
A few weeks ago I wrote about the daring defection — and eventual rescue — of a North Korean soldier who barreled across the Demilitarized Zone in a truck and...
Read more →
Mapping 2011 Earthquakes
This 2011 earthquakes map, rendered in Google Earth, shows just how rare seismic events are on the East Coast: View larger version UPDATE: Adding historical data I discover… This map...
Read more →
sunfoundation: Google Map Maker edits in real-time Google Map Maker is a simple tool that lets you d
[caption id="attachment_165" align="alignnone" width="620" caption="sunfoundation: Google Map Maker edits in real-time Google Map Maker is a simple tool that lets you d"][/caption]
Read more →
Mapping Three Decades of Japanese Earthquakes
Using data collected by the U.S. Geological Survey, anyone can download historical data on earthquakes across the globe in various formats. Here’s a screenshot in Google Earth from a KML...
Read more →