Posts tagged "immigration"
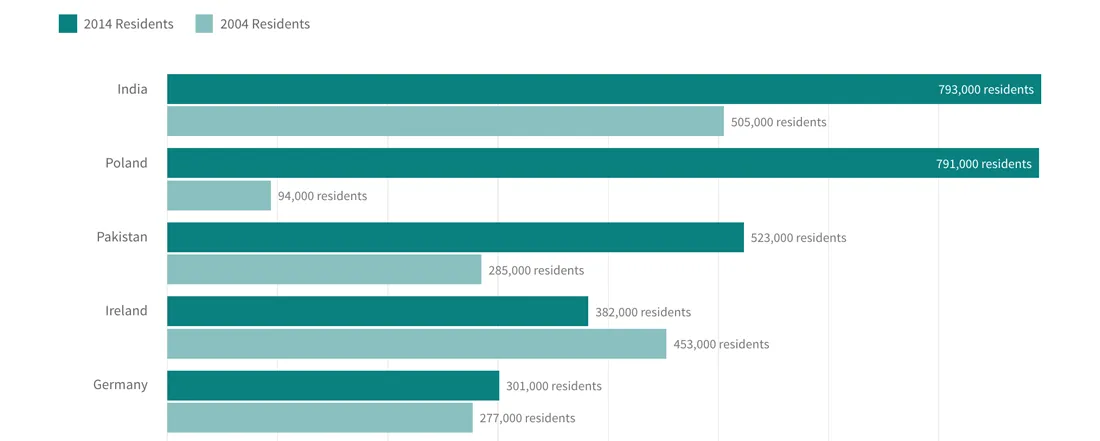
Charting U.K. Immigration by Country
Outsiders, like me, who are trying to understand how much immigration is driving the "Brexit" debate about the European Union might consider this fact: Britons are much more likely today...
Read more →
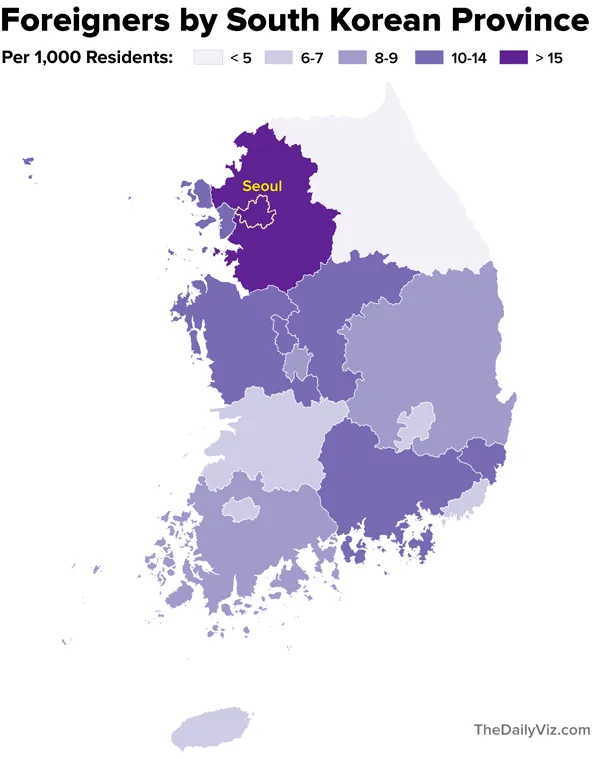
South Korea's Foreigners, Over Time
Note: My family last year relocated to Seoul, where my wife is working as a foreign correspondent for NPR. This post is part of an occasional series profiling the peninsula’s demographics and...
Read more →
Where are Korea's Foreigners From?
[caption id="attachment_2119" align="aligncenter" width="610"] Separating foreigners from the locals at a recent street festival celebrating Buddha's birthday.[/caption] Note: My family last year relocated to Seoul, where my wife is working as...
Read more →
Charting Border Agents, Apprehensions
The U.S. Border Patrol told Congress on Tuesday that the number of apprehensions along the Mexican border was at a 40-year low. The trend prompted the agency to propose a...
Read more →
U.S. Naturalizations by Country
The Department of Homeland Security now posts records detailing how many people become U.S. citizens each year, and from which countries. Visualizing this data on a world map is easy,...
Read more →