D.C. Population, Crime by Political Wards
I’ve posted before about crime in Washington, D.C., a city I’m still working to understand demographically and geographically. Here are some maps I made this morning as part of that process.
First, here’s a look at population* by political ward (I live in Ward 5). Darker shades represent more residents. Notice that population is concentrated more heavily in the northern and northwestern wards in the city:

This map shows population density (residents per square mile) by political ward. Darker shades represent increased density. Notice Ward 1, which is the most diverse in the city, also has the most density. It includes neighborhoods such as Adams Morgan, Columbia Heights and Shaw:

Next, I mapped the numbers of major crimes reported in each political ward during 2008, 2009 and 2010. Darker shades represent more incidents. It’s clear that crime is more common in the southern and southeastern wards, which also have the poorest and most undereducated residents.
First, homicides. Ward 8 had the most, 142, which is about a third of all killings in the district since January 2008:

Robberies are also common in southeast, but look at densely populated Ward 1. It had more robberies than any other district during the three year period — 2,200.

Assaults with deadly weapons:

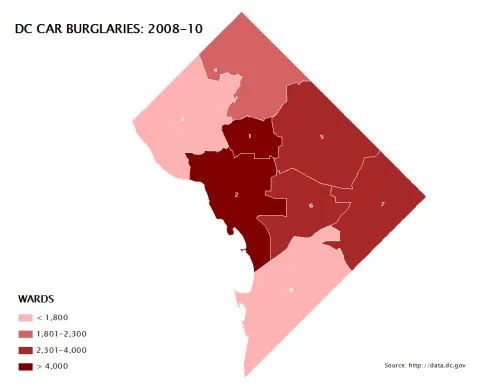
Burglaries:

This is interesting. Vehicle burglaries were most common in wards 1 and 2, perhaps because they are densely populated and, in Ward 2’s case especially, among the wealthiest:

Source: DC Data, U.S. Census | Get crime data
* Population totals based on 2000 census. Ward-level population totals haven’t yet been compiled and released by the district government.