Comparing President Obama's Job Approval Rates Among Different American Groups
President Obama's approval rating has crept just above 50 percent, his best position in a year, the latest Gallup survey figures show. The Washington Examiner adds some historical context:
Obama's numbers peaked at 53 percent in the last week of May [2011], but then dipped below 50 percent in June [2011]. His approval ratings sank to a low of 38 percent in October 2011, before returning to 50 percent in mid-April 2011.
[caption id="attachment_625" align="alignright" width="300" caption="Click on the image to interact with the charts."] [/caption]
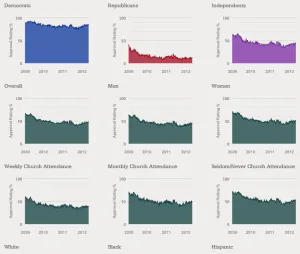
Using Gallup's weekly trends data — which can be sliced into groups based on religion, gender and party identification, among other categories — I created numerous interactive charts to show the trends since his presidency began in January 2009.
The charts reveal some interesting, though perhaps not unexpected, trends. First, of course, there's a clear partisan divide: 83 percent of Democrats approve of the president's performance while just 13 percent of Republicans approve, according to the most recent weekly trends data provided by Gallup (through April 29).
But other differences are evident. Only 40 percent of people who told Gallup that they attend church weekly approve. Compare that with 54 percent approval among people who rarely go to church. Older and wealthier people also approve at lower rates.
I've broken the numbers out into 21 different area charts. Explore them here.
A warning: The page is a bit sluggish in Internet Explorer. I haven't had time to fix that. So, click here to get a proper browser.
UPDATE: I added fresh data on May 27, so the graphics are current. Check them out.