Mapping 'Majority Minority' Counties
This week the U.S. Census Bureau released updated national population estimates, including a list of the counties that grew most rapidly from 2010 to last summer. I wrote about these counties in a political context this week for work.
Included in the release was a note that six more counties had flipped to "majority minority," as the bureau calls them. These are counties in which non-Hispanic whites represent less than half the population.
With those six, the country now has at least 352 counties — about one in 10 of the total — in this category. Here they are on a map:
[caption id="attachment_1407" align="alignnone" width="620"] The Daily Viz[/caption]
These counties exist largely because because of the relative size of the Hispanic and black populations (though Hawaii and Alaska have high Asian population rates), depending on geography. Western counties have higher percentages of Hispanic residents, and counties in the Deep South have higher rates of black residents. Of course there are some exceptions sprinkled throughout the country.
This map shows the rate of "minority" residents by county:
[caption id="attachment_1408" align="alignnone" width="620"] The Daily Viz[/caption]
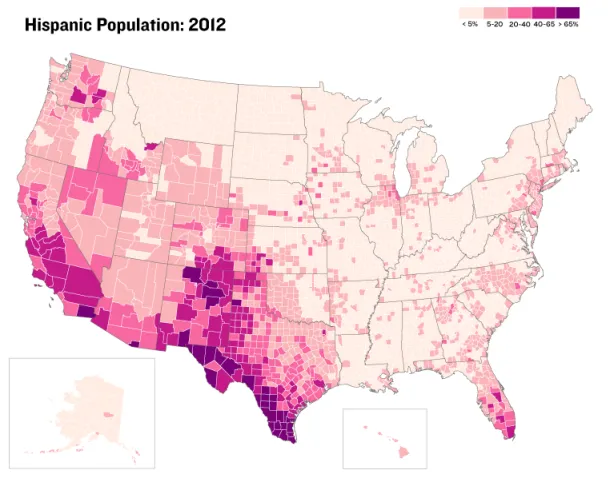
This map shows the percentage of Hispanic residents by county:
[caption id="attachment_1409" align="alignnone" width="620"] The Daily Viz[/caption]
This map shows the percentage of black residents by county:
[caption id="attachment_1410" align="alignnone" width="620"] The Daily Viz[/caption]
You can download the data here. Tomorrow we'll examine how these counties voted in the 2012 presidential election.
For more updates, follow me on Twitter.