A Random Generator of Random @mapmakerbot Maps
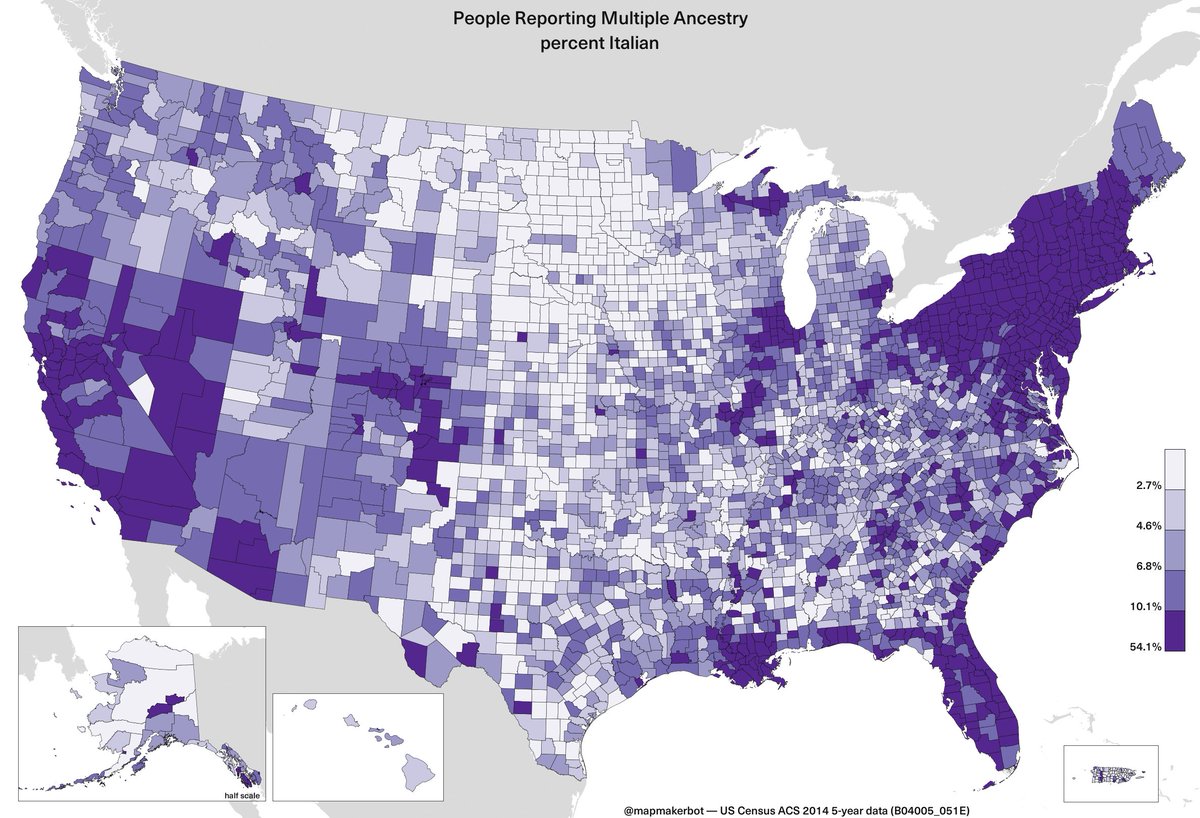
One of my favorite Twitter bot ideas is @mapmakerbot, which visualizes American demographic data each hour in the form of county-level maps. You can read the technical details here.
The bot, created by New York artist Neil Freeman, has posted thousands of maps this year. Some are interesting. Others not so much, as the author notes:
The bot creates maps of county-level data, grouped by quintile. The bot functions as an educational tool, and as a critique of a facile approach to official statistics and map-making. The bot's functional but hardly insightful maps offer a veiled critique of the blind use of data to offer insight.
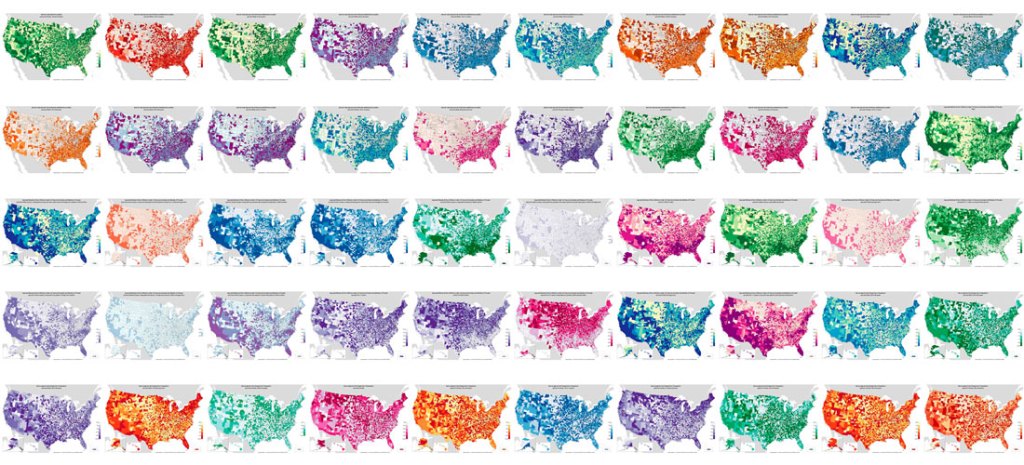
See for yourself. More than 1,000 maps, at random: