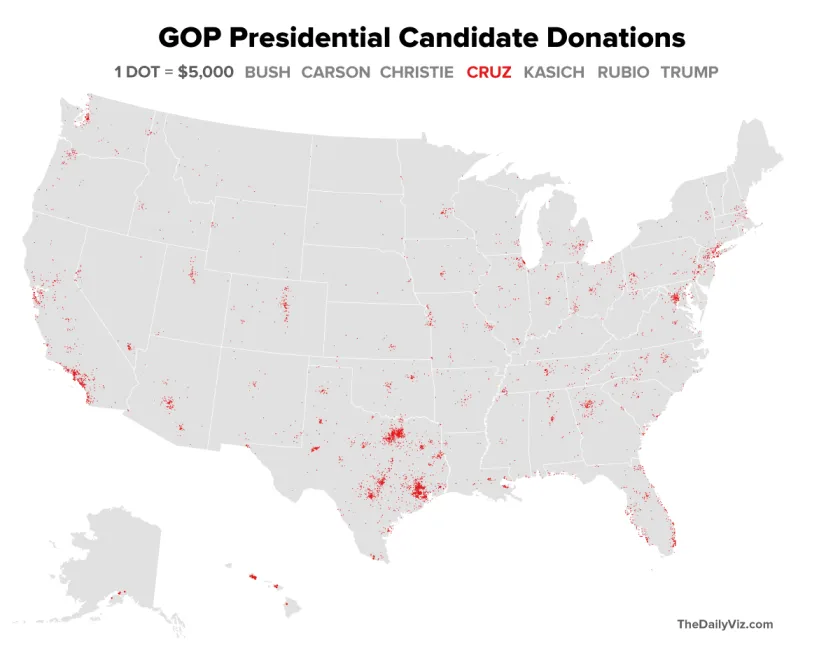
Mapping GOP Campaign Cash by Density

By Matt Stiles | | Topics: Policy & Politics

The GOP presidential candidates collectively have raised more than $300 million in this election cycle, according to Federal Election Commission data. Here’s a quick look at where several of those candidates — Jeb Bush, Ben Carson, Chris Christie, Ted Cruz, John Kasich, Marco Rubio and Donald Trump — collected the money.

Each dot on the maps (see update below) below represents at least $5,000 raised by zip code. The dots in each place are assigned randomly within the zip code boundaries, creating a density map (think Verizon vs. AT&T) for campaign donations* through Feb. 29.

Here’s a (crowded) map with all the candidates. The dots were layered alphabetically, a method that unfortunately obscures some candidates at this scale, depending on the geography. Still regional differences are evident:

zips_gop_contribs_all

JEB BUSH

The former Florida governor raised large amounts of money, of course, from his home state, but also — as the perceived frontrunner for a time — from major population centers:

zips_gop_contribs_bush_red

BEN CARSON

Carson raised a ton of money for someone who received relatively little love once voters started casting their ballots. His map shows he raised more from small locations throughout the country, not just the major population centers:

zips_gop_contribs_carson_red

CHRIS CHRISTIE

The New Jersey governor, understandably, raised a large proportion of his money from his home region:

zips_gop_contribs_christie_red

TED CRUZ

The Texas senator raised money from all over the country, but he clearly has a financial base in Dallas-Fort Worth, Austin, San Antonio and Houston — the major population centers in his home state.

zips_gop_contribs_cruz_red

JOHN KASICH

Like Christie, the Ohio governor tapped his donor base at home:

zips_gop_contribs_kasich_red

MARCO RUBIO

The Florida senator’s map looks much like that of his frenemy, Bush:

zips_gop_contribs_rubio_red

DONALD TRUMP

The billionaire business man, who has relied largely on personal funds for his campaign, has raised very little money in checks larger than $200, as reflected in his map:

zips_gop_contribs_trump_red

* To keep the analysis consistent for all campaigns, the maps were created with a data set that excluded individual donations of less than $200. The data include only donations to the candidates’ campaign committees, not other political committees supporting them.

UPDATE (9:20 p.m. EST): Based on David’s suggestion in the comments, I’ve changed the dot color in the individual maps so it’s consistent. You can see the originals here: Bush | Carson | Christie | Cruz | Kasich | Rubio | Trump.

Candidate Fundraising vs. Super PAC Spending in January

By Matt Stiles | | Topics: Uncategorized

From Huffington Post

Reports about January’s fundraising numbers, released on February 20, have focused on two narratives: Mitt Romney’s limited fundraising and high burn rate and the role that super PACs are playing in an increasingly contested Republican primary. HuffPost decided to combine those narratives together to make a graphic of candidate and super PAC fundraising and spending in January.

Colbert and the Clouds

By Matt Stiles | | Topics: Uncategorized

Stephen Colbert this week used word clouds — visual representations of word frequencies in selected blocks of text — to tell a story about his political action committee.

Colbert recently asked supporters to submit suggestions for the PAC’s mission, and he wanted to visualize their responses for his television audience.

This version shows the most popular words in all the responses: 

Then, Colbert (or presumably someone on his staff) weighted the cases to represent only responses by donors who gave at least $1. 

The second version represents the responses Colbert “heard,” I suppose making a point about the fact that corporate spending is now considered political speech.

Genius. Here’s the full sketch

Rick Perry: Fundraiser

By Matt Stiles | | Topics: Uncategorized

Now that Texas Gov. Rick Perry, R-Texas, is officially in the presidential race, reporters are noting his campaign fundraising prowess as a possible strength that could propel him to the GOP nomination: 

But it is a credential Mr. Perry is unlikely to highlight that could make him the most formidable entrant in the Republican race so far: he is among the top political fund-raisers in the country, with a vast network of wealthy supporters eager to bankroll his presidential ambitions, and he has the potential to energize Republican donors who have shown only limited enthusiasm for the candidates already in the race.

Indeed, Perry has raised more than $100 million in his decade-long tenure as governor, including $39 million in the his 2010 re-election effort, according to electronic campaign reports in Texas.

Here are his fundraising totals by year: 

And a breakdown of how much he’s raised from individual donors versus entities, such as law firms and political action committees: 

Nine in 10 dollars collected by Perry came from Texas donors, but he has raised money from every state (darker shades represent higher dollar amounts): 

Here’s a map that visualizes totals donated per household in each state. You can see that Colorado, Delaware and Washington, D.C., gave at higher proportions than other states (except for Texas, of course): 

Finally, here’s a word cloud that highlights the most common donor occupations listed by Perry’s campaigns over the years, eliminating the phrase “Best Efforts.” The latter phrase is required in state law if a campaign can’t identify a donor’s occupation. (The Perry team has done that quite a bit over the years). 

Download data: CSV

Congressional Campaign Totals

By Matt Stiles | | Topics: Uncategorized

Members of Congress recently filed their quarterly campaign-finance reports, which detail their political fundraising, spending, cash on hand and debts. The Center for Responsive Politics posted the totals for all House and Senate members yesterday. This map shows fundraising totals by state:

Here’s a per-capita version:

The interactive version lets you toggle views between fundraising, spending, debt and cash.

Financing Texas Elections: 2010

By Matt Stiles | | Topics: Uncategorized

Another cross-post from my work blog:

The 2010 political campaigns are over, but looking back at the fundraising and spending that financed them is now fully possible thanks to records made public by the Texas Ethics Commission after Tuesday’s filing deadline. 

With this new data, which cover donations and expenditures from October 24 to December 31, we can now illustrate campaign activity for the full year. This column chart visualizes campaign activity, by day, for all candidate/officeholders and specific-purpose committees during 2010. Red spikes represent spending; blue spikes represent fundraising.

(View a larger version)

The graphic offers an interesting, though not necessarily unexpected, timeline of the campaigns, which spent about $180 million during the year — not including what third-party groups devoted to the various contests up and down the ballot. I’ve highlighted spikes in activity that correlate with high points of the campaign. 

Notice spikes in the competitive Republican primary contest between Gov. Rick Perry and Sen. Kay Bailey Hutchison, as well as the Democratic primary between former Houston mayor Bill White and hair care magnate Farouk Shami. The largest came on Feb. 18, when Perry, Hutchison and Shami spent about $3.5 million on television advertising ahead of Election Day. 

There’s a similar spike before the general election contests including Perry and White, and all the competitive and expensive Texas House races. The largest jump came on Oct. 15, when Perry and Lt. Gov. David Dewhurst, who was fending off a challenge from labor leader Linda Chavez Thompson, purchased $5.1 million in television time. 

Other events are highlighted, too. You’ll see that fundraising jumped sharply on June 30, the mid-year filing deadline. It also spiked on Sept. 23, which was a deadline for the 30-day ethics filing, which is released Oct. 4. Another spike occurred on Dec. 11, the day before a fundraising moratorium before the 82nd legislative session.

Let us know if you have ideas for data-driven features or visualizations, and be sure to follow @TribData on Twitter.

UPDATE: Here’s a quick interactive version built with the Google Visualization API