Posts tagged "Fusion Tables"
How I Lost My (Former) Congressman
Ryan Murphy at The Texas Tribune created this awesome mapping feature that allows users to search their addresses to see how their representation in the U.S. House may have changed during...
Read more →
iPhone Travel
I ditched the BlackBerry two years ago this week. Here’s where I’ve been since my iPhone started logging my travel coordinates (56,000 records and counting):
Built with Fusion Tables.
Read more →
Congressional Seniority
An interactive map from work: This map visualizes the number of years officials have served in the U.S. House of Representatives, with darker shades representing longer seniority. Toggle the map below...
Read more →
Mapping World Gas Prices
Inspired by FlowingData’s post, I mapped world gas prices by gallon in U.S. dollars. Gas is most expensive Turkey ($9.69) and The Netherlands ($9.01), where my mother in law lives and...
Read more →
Mapping Three Decades of Japanese Earthquakes
Using data collected by the U.S. Geological Survey, anyone can download historical data on earthquakes across the globe in various formats. Here’s a screenshot in Google Earth from a KML...
Read more →
The State of Facebook
The percentage of Facebook users by state as of Dec. 2009 (darker shades represent higher rates of usage):
Sources: Google Fusion Tables, U.S. Census Bureau | Data
Read more →
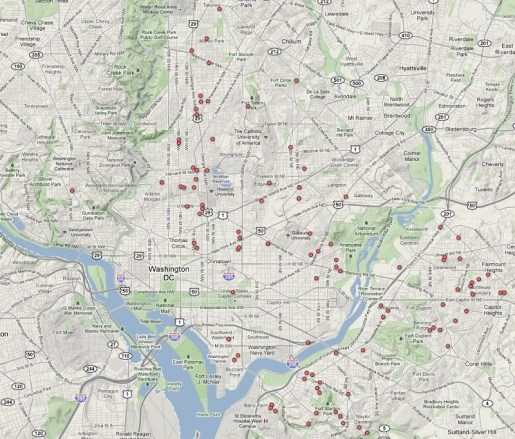
D.C. Homicides
The Washington, D.C., official data catalog is a rich source for information about the nation’s capitol. Users can download dozens of free GIS products as well as datasets related to city...
Read more →