Posts tagged "Line Chart"

Visualizing Historical Political Party Identification in the Era of Trump
As many have noted, President Trump has shown a remarkable ability to maintain a strong base of support — about 40% of the voters — despite the myriad controversies swirling around him....
Read more →

Charting the Korean War's Missing Troops
I wrote recently about the effort to get North Korea to return some of the remains of United States troops who are still unaccounted for since the Korean War. More...
Read more →
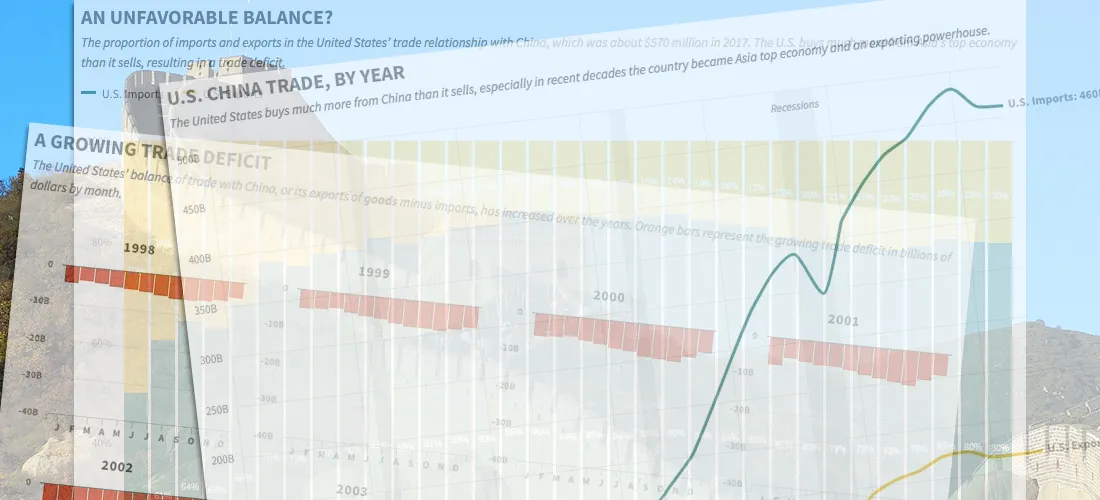
China's Imbalanced Trade with the United States, in Four Charts
A trade war could be looming between the United States and China, fueled by President Trump's fixation on the two nations' unbalanced import-export relationship. The trade imbalance between the two...
Read more →

How China's Economic Retaliation Hurt the South Korean Tourism Industry
I wrote this week about the one-year anniversary of China's economic retaliation against South Korea over the THAAD missile system, a defensive weapon designed to stop North Korea's medium-range missiles....
Read more →
It's Been a Hot Summer, Down Under
My family is vacationing this week in Mosman, Australia, a harbourside Sydney suburb near Balmoral Beach known for its family friendly attractions and boutique shops. This place is a great...
Read more →

America Imports Lots of Stuff from China, Including Christmas Decorations
Last year, the United States imported more than $460 billion in goods — clothes, toys, gadgets, you name it — from China. Of course, our Christmas decorations were on that list,...
Read more →
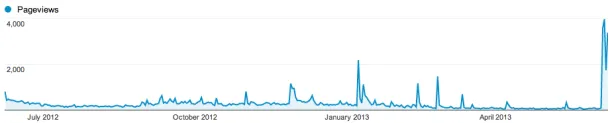
Charting NICAR Attendance, Over the Years
Next week is the Investigative Reporters and Editors annual CAR convention — the gathering of news nerds from across the world to discuss the latest and greatest in data journalism. This...
Read more →
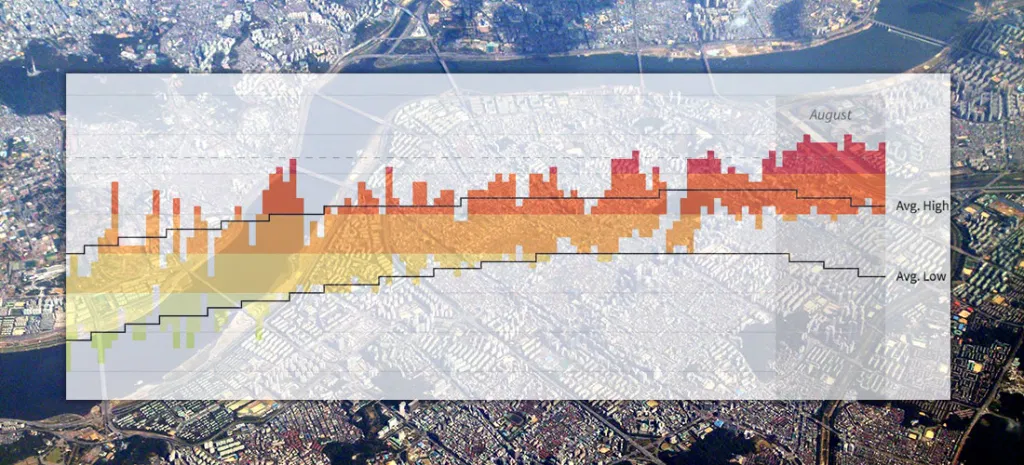
Seoul's Steamy Summer (Updated)
Note: I followed my wife, a foreign correspondent for NPR News, to Seoul last year. This is one of a series of posts exploring our adopted country's demographics, politics and...
Read more →
Charting New York City's Changing Borough Population, Over Time
I woke one recent morning at 5 a.m. obsessing about, of all things, the people of New York City — specifically how the population is distributed among the five boroughs: Brooklyn,...
Read more →
How Immigration is Animating the 'Brexit' Vote, in Four Charts
Immigration to the United Kingdom has risen sharply in recent years, and it's fueling the debate about Britain's looming "Brexit" vote on whether to leave the European Union. Many supporters...
Read more →
Air Quality in Seoul, China, U.S.
[caption id="attachment_2325" align="aligncenter" width="1000"] The view from our apartment in Seoul. Some days are better than others.[/caption] The air quality in Seoul — a mega city home to 70,000 taxis and...
Read more →
Charting a Sky-High Electricity Bill
What of the biggest surprises about moving to Seoul, South Korea — aside from the impenetrable language and other cultural adjustments — was the pricey cost of electricity. The monthly power bills...
Read more →
A Century Of Global Plane Crashes
Investigators still want to know what caused a civilian airliner to crash Tuesday morning in the French Alps. The incident, which likely killed 144 passengers and six crew members aboard...
Read more →
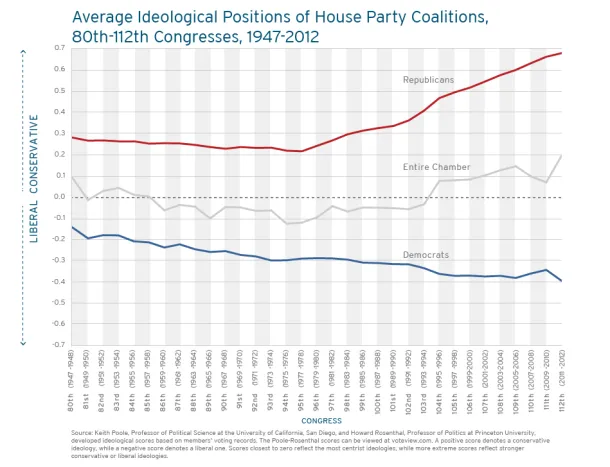
Charting Partisan Polarization in Congress
The Fix today has a post about the newly released digital version of Vital Statistics on Congress, a partnership between between a few think tanks that contains reams of enlightening...
Read more →
Birthday Heatmap Born Again
Last year on my birthday I created a quick heatmap visualizing birthdays by their rank on the calendar. Despite its flaws, the graphic went viral by The Daily Viz standards,...
Read more →
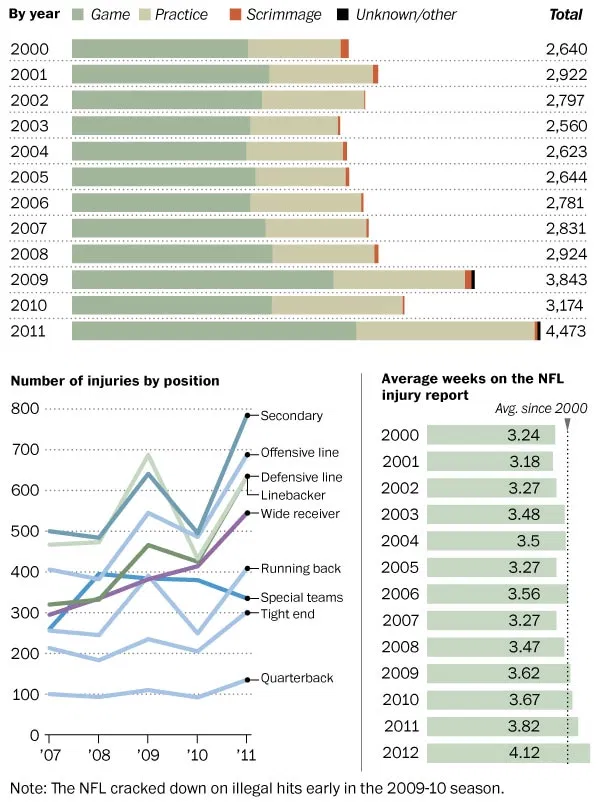
Charting NFL Injuries
The Washington Post has a fascinating story today about NFL players and injuries, with the local peg being Robert Griffin III's knee injury. The gist: Interviews with more than 50...
Read more →
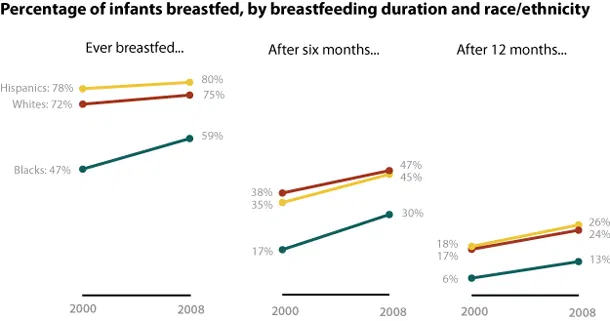
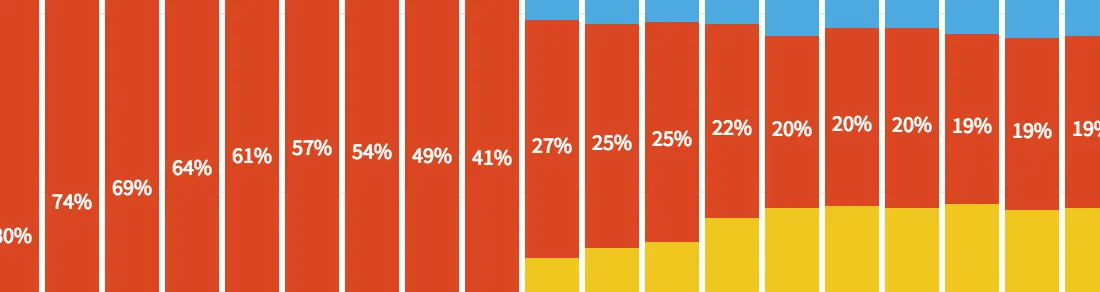
U.S. Breastfeeding Rates By Duration, Race/Ethnicity Over Time
Early this month, the Centers for Disease Control released a study analyzing breastfeeding in America, noting that the percentage of babies who were breastfed increased by four points from 2000...
Read more →
Visualizing Gas Prices by State, Income and Time
Gas prices risen for the eighth straight day, part of a trend that’s driven the cost up 17% this year, according to AAA data reported by CNN Money: The national...
Read more →
Charting Recessions and Recoveries
Amanda Cox from The New York Times charted the current downturn compared with history: Horizontal axis shows months. Vertical axis shows the ratio of that month’s nonfarm payrolls to the nonfarm...
Read more →
Charting Days Members of Congress Spend in 'Session'
Time is winding down on another year of congressional business. How much time have representatives and senators worked this year compared to the past? Senators, on average, were in session...
Read more →
A Rough Year for AMR
American Airlines’ parent company, AMR Corp., announced today that it had filed for Chapter 11 bankruptcy protection. AOL DailyFinance summed up the effect on investors: AMR’s investors got a nasty...
Read more →
U.S. Broadband Internet Speed
How the U.S. compares with other countries in average broadband download speed, via the Google Public Data explorer:
Read more →