Visualizing World Alcohol Consumption: What Beverages Do Countries Prefer?
I posted recently about how countries consume different amounts of alcohol — and how some have wider gender gaps when it comes to booze.
The previous posts relied on two data sets from the World Health Organization, which calculates consumption (in liters and grams) based on surveys and actual import, exports and sales data. The organization, a reader noted recently, also breaks down the consumption totals proportionally by beverage.
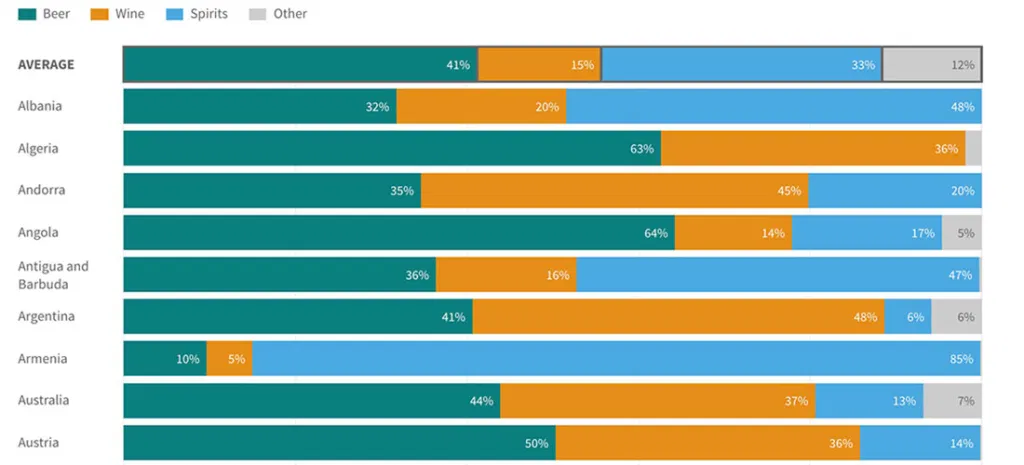
This chart shows each country and its relative tastes for beer, wine, spirits and "other," which, in South Korea at least, is mostly soju, a fermented rice beverage that's not easily categorized.
Countries on average consume beer first (about 41 percent of their alcohol diet), followed by spirits (33 percent), wine (15 percent) and other (12 percent). I've listed bars for the average, the United States and South Korea (my current home) first. The rest are listed alphabetically by country. How does yours compare?