A few weeks ago I posted about gender gaps in alcohol consumption around the world.
In some countries — South Korea, for example — men and women consume quite different amounts of booze, according to the World Health Organization. Fueled by a love for soju, South Korea’s men are among the heaviest drinkers in the world, consuming about 78 grams per day — nearly twice as much as other men on average. Its women drink only slightly more than their counterparts abroad, on average.
But that data only averaged daily consumption, by country, among people who list themselves as “drinkers”. The organization also has estimates about per-capita consumption amounts based on countries’ import, export and sales data, normalized with their adult populations. Depending on your question, that might be more useful information.
Those data, which also offer a breakdown of alcohol types (beer, wine, spirits and “other”), tell a different story. Instead of leading the world, by that measure South Koreans rank farther down a list of 196 countries: 35th.
Belarus tops that list with a per-capita rate of about 17.3 liters of alcohol consumed annually. South Korea’s rate, by comparison, is about 9.3 liters per person annually, and America’s rate is around 8.7 liters. Both are still relatively high compared to rest of the countries in the organization’s database. Of course, the predominantly Muslim countries in the Middle East drink next to nothing, at least officially.
Here’s a map showing the consumption total for each country, with darker shades representing more drinking:
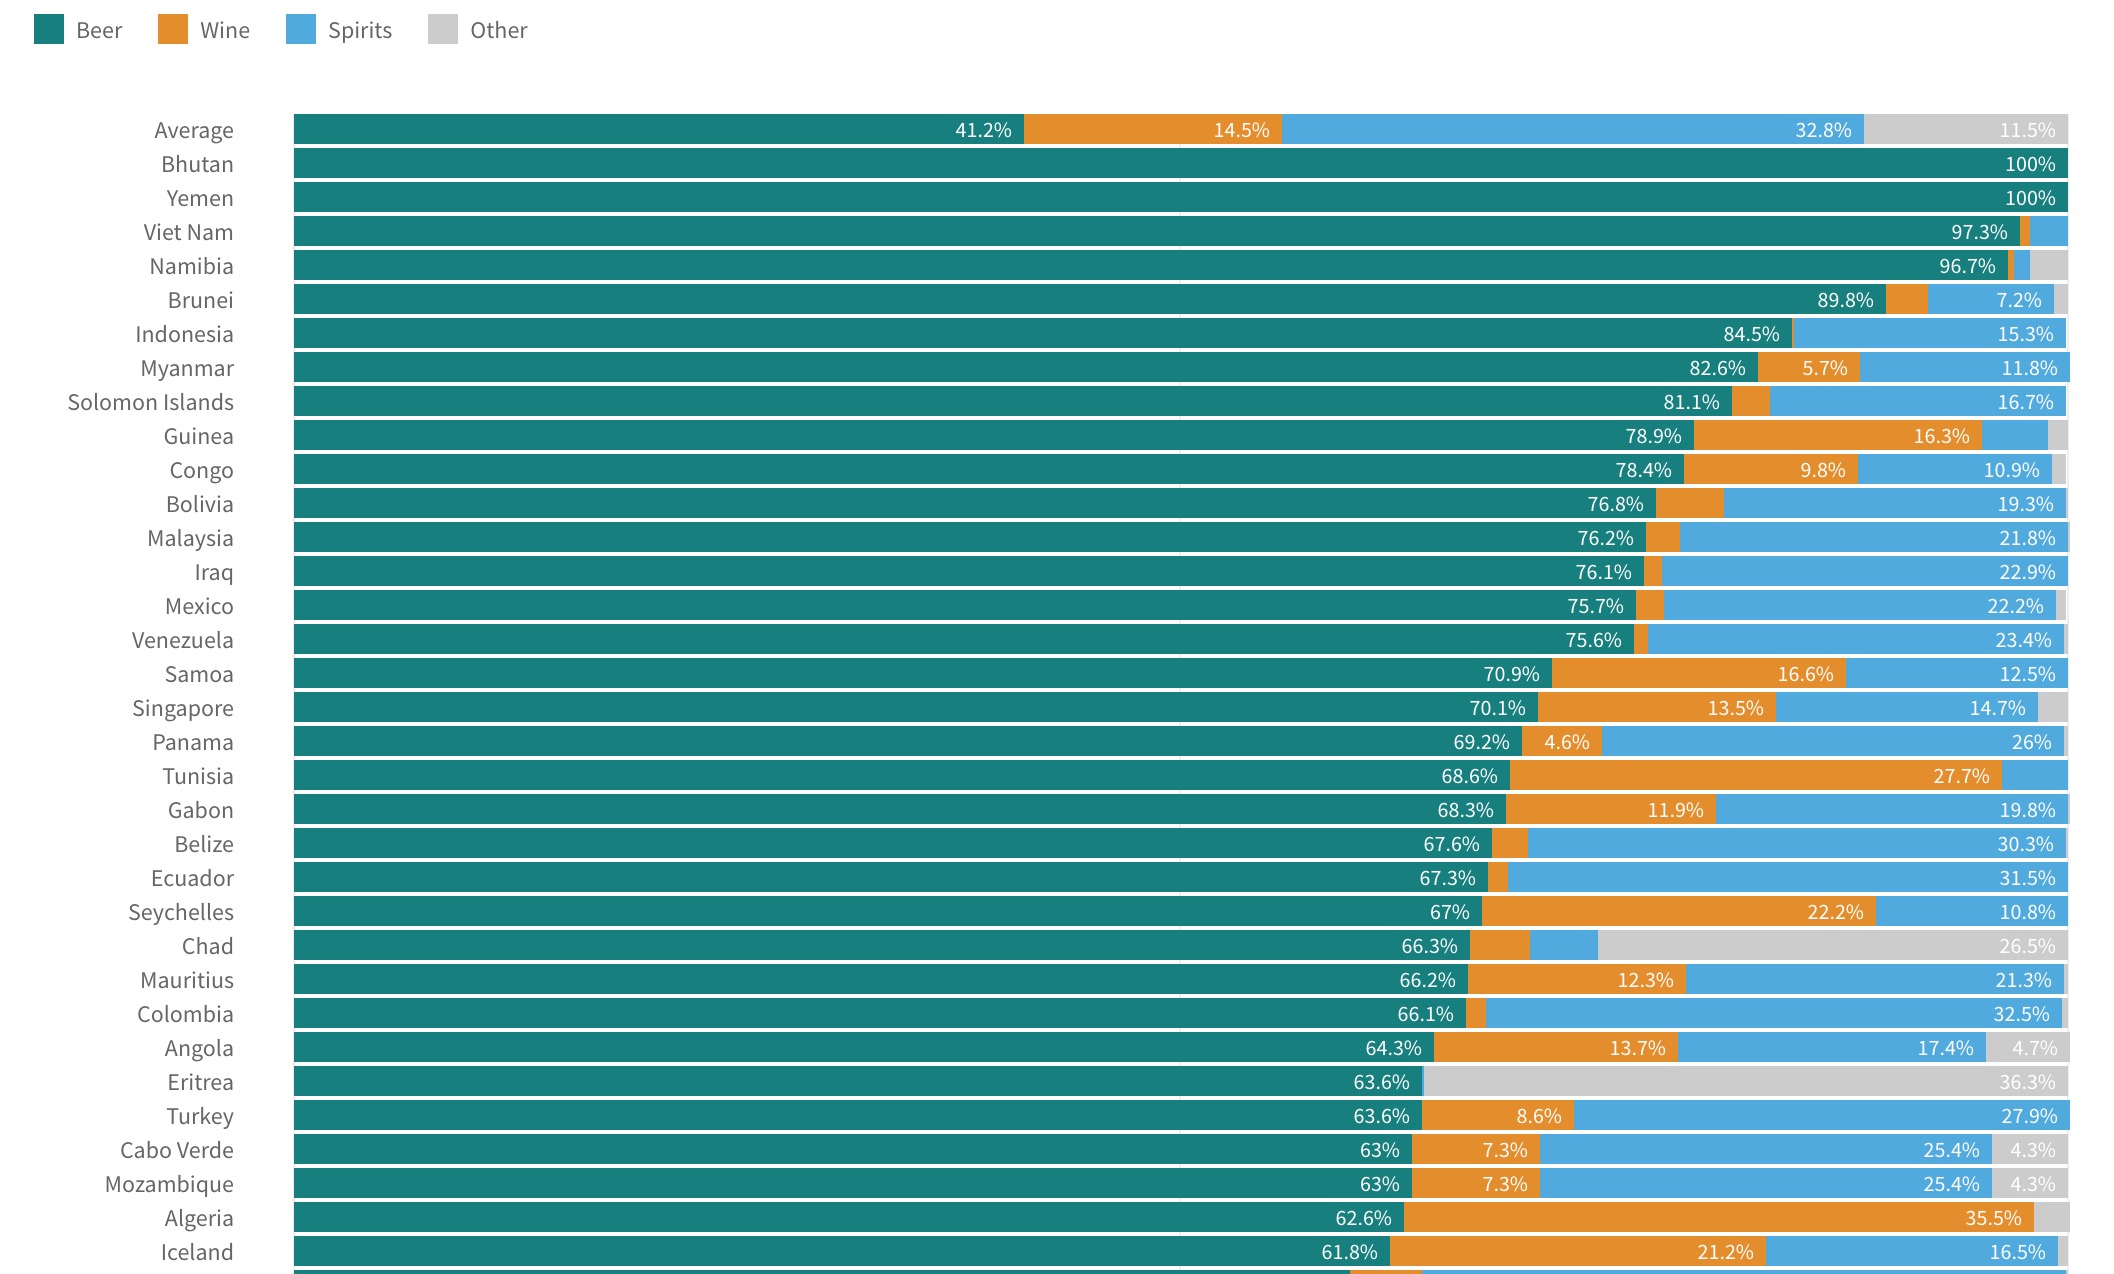
The total consumption is only part of the story, however. Western Europe, for example, generally drinks more wine (Portugal and France top the list) and beer (Austria and Germany are high on the list). Eastern European generally prefer spirits (hello Russia, Belarus and Bulgaria).
Some countries in Africa like the organization’s category of “other” more than conventional types of booze, as does South Korea. I suppose that’s a reference, at least in Uganda’s case, to waragi, a moonshine made from bananas. South Koreans drink a lot of soju, a distilled rice liquor that doesn’t neatly fit into the beer, wine or spirits categories.
Explore the data, separated by regions, in this table:
Since average alcohol content by volume varies from under 5% for beer to over 40% for spirits, it’s worth noting that the WHO data used is for “Consumption of pure alcohol by type of beverage (%)”, which normalizes the data. I’m curious about the numbers in the table. My download of the data from the link provided gives different values. At first, I thought they might be in months (divided by 12), but a little investigation with a few countries showed a difference in factor by a range of around 7 to 13. For example, South Korea: beer is 25 in the downloaded data, which is 12.9 times greater than 1.94 here; spirits: 3 (7.9 times greater than 0.38), wine: 1.6 (12.3 times greater than 0.13), other: 70.5 (10.2 times greater than 6.9).
Hey, Curtis. Thanks for your note. The WHO has many alcohol tables, and it appears I linked to the incorrect one. I’ve corrected the link in the map and table. The data you looked at, though, could be more useful. Investigating…
OK. Now I understand. I used this data set for the map and table. It has the per-capita amount of “pure alcohol” consumed by country. The WHO factors these totals by considering the alcohol content of beer, spirits, etc. So it’s normalized.
The data set I incorrectly listed initially in the graphics (sorry about that, btw) uses the same pure alcohol methodology. But it lists percentage breakdown (rather than a liter figure) of overall consumption by type. So in South Korea, for example, it breaks down like this: 70% other, 25% beer, 1.6% wine, 3% spirits. So 70 percent of the booze consumed here is “other,” or soju, which seems correct from my experience watching Koreans drink.
The latter might work for a stacked bar chart. We’ll see… Thanks again for your note. Ping me if this doesn’t make sense.
A quick sketch…
It seams that at least for Russia alcohol consumption is hugely underestimated. According to research cited in wikipedia (https://en.wikipedia.org/wiki/Moonshine_by_country#Russia) shows that amounts of ‘samogon’ – the illegal substitute for vodka, consumed was at the time of research almost five times bigger than of the official vodka. I think approximate corrections for illegal alcohol consumption would alter the table quite a bit.
Samogon isn’t illegal at all, you can buy it in stores or make it yourself but it’s consumption is very low compared to the 1990s and it is time consuming to make yourself, people don’t really bother with it now-a-days since they can easily buy alcohol in a store for a low price and not waste time/resources. It is calculated under “other”.
There is something odd about geographical categories here: so Israel is Europe and Lebanon is a new continent called “Easterrn Mediterranean”??
Best stats. Thanks!
Hi Matt – would you be able to calculate/approximate total worth of alcohol industry? Would be interesting to see how much is spent on alcohol vs education, healthcare, etc.
That’s an interesting question. I don’t have time to calculate that, sorry. If you do, perhaps we can work together.
Hi Matt – I posted my question on December 28th 2016. Today is 14th of February 2017. Yes or No would be great. Many thanks. Br, Tomislav
I like the efforts you have put in this,
thank you for all the great articles.
Thanks, Jovita Wylie for thedailyviz.com