Charting Car Burglaries in DC
Last week someone burglarized our car. Fortunately the burglar didn't get much, if anything, and a window wasn't smashed. (Someone left the door unlocked, apparently). But it was a reminder that, even though our Brookland neighborhood is quiet and safe, we're still vulnerable to property crimes. Then this morning I noticed that a neighbor's driver-side window had been smashed in a burglary.
Looking at the data, it doesn't appear that car burglaries are on the rise in our larger neighborhood, Ward 5. Residents here reported 109 car burglaries in January, for example, but only 59 in April. There also doesn't appear to be a week-to-week uptick in April. I wondered whether the time of year makes car burglaries more likely, so I downloaded six years of major crime data (170,000 incidents of murder, robbery, theft, car theft, arson, sexual abuse, and vehicle burglary) to find out.
This chart shows the six-year trend, by month, in the city for car burglaries. There has been an uptick in recent history during May, it seems. Incidents of the offense have then leveled off before spiking again in the fall:

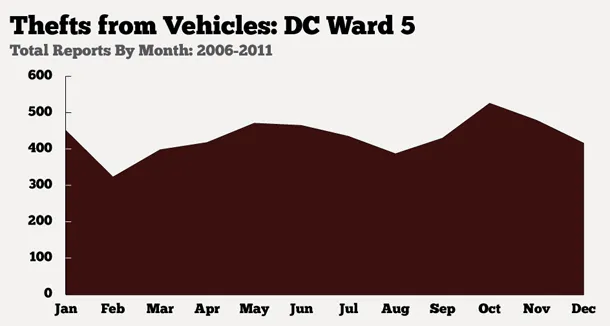
Our ward has shown a somewhat similar trend:

Data source: data.dc.gov