Crime and justice
Crime statistics, law enforcement data, and justice system analysis
Editing O.J. Simpson: Charting Changes to His Wikipedia Page
I've just finished watching ESPN's fabulous O.J.: Made in America, a five-part documentary about the Hall of Fame football player. Somewhere in the process of digesting this latest — and,...
Read more →
South Korean Women (Especially Young Women) Fear Crime More Than Men
The recent murder of a young woman in Seoul's Gangnam district has prompted discussion about the treatment of women in South Korean society, including lingering gender inequality, harassment and even physical violence....
Read more →
Murder Rates in the U.S., Korea
Note: My family last year relocated to Seoul, where my wife is working as a foreign correspondent for NPR. This post is part of an occasional series profiling the peninsula’s demographics and...
Read more →
New Show, Knife Raise O.J.'s Google Profile
More than 20 years after his blockbuster murder trial, O.J. Simpson is back in the news — this time after Los Angeles police reportedly found a knife on the grounds...
Read more →
Mapping Police Officer Slayings by State
[caption id="attachment_1716" align="alignright" width="300"] Newly sworn in police officer Ashley Guindon, center, was killed responding to a 911 call on her first day working for the Prince William County (Va.)...
Read more →
Sketching D.C. Crime Data With R
A car burglar last week nabbed a radio from our car, prompting me to think (once again) about crime in Washington, D.C., where I live. I wanted to know if...
Read more →
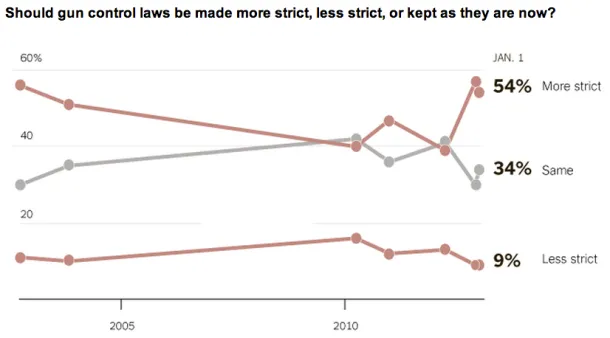
Charting Views On Gun Control
The latest New York Times/CBS News poll shows support among Americans for stricter gun control laws: The massacre of children at an elementary school in Newtown, Conn., appears to be...
Read more →
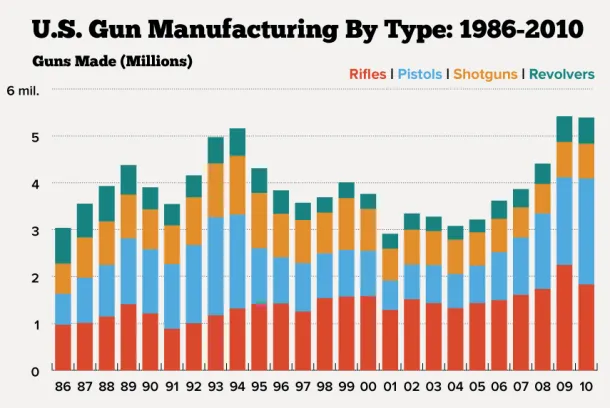
Charting U.S. Gun Manufacturing
More than 5 million guns were made in the United States in 2010, according to the latest data available from the U.S. Bureau of Alcohol, Tobacco, Firearms and Explosives, among...
Read more →
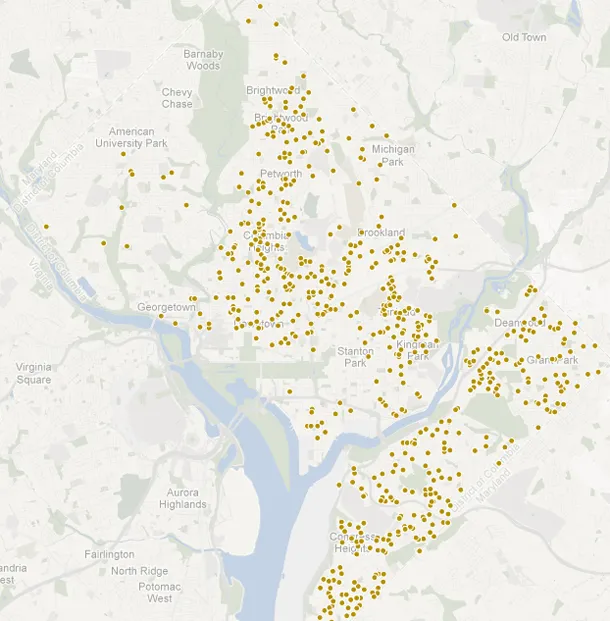
Mapping Crime Data With CartoDB
Today I started playing with CartoDB, an online data mapping service that reminds me in some ways of both Google Fusion Tables and TileMill. To start, I grabbed a simple...
Read more →
Inside U.S. Prisons — From Above
A few years ago, the great Niran Babalola and I dreamed up a news app that included all inmates and prison units in Texas. We built it because the state's...
Read more →
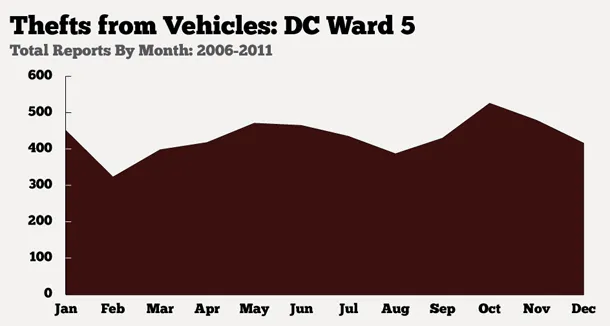
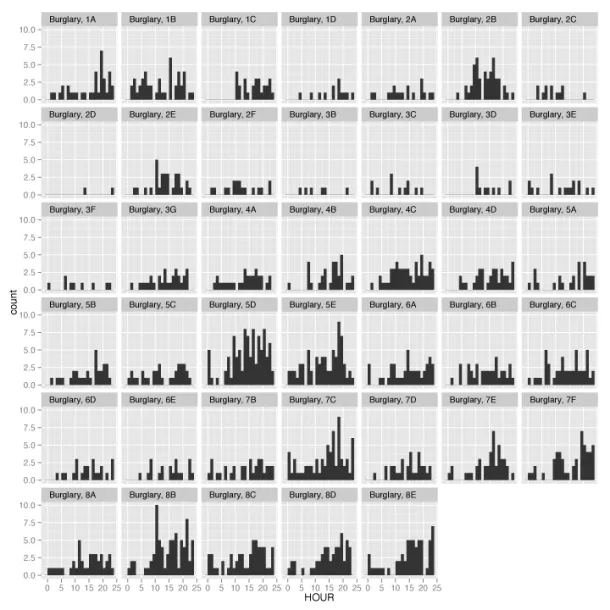
Charting Car Burglaries in DC
Last week someone burglarized our car. Fortunately the burglar didn't get much, if anything, and a window wasn't smashed. (Someone left the door unlocked, apparently). But it was a reminder...
Read more →
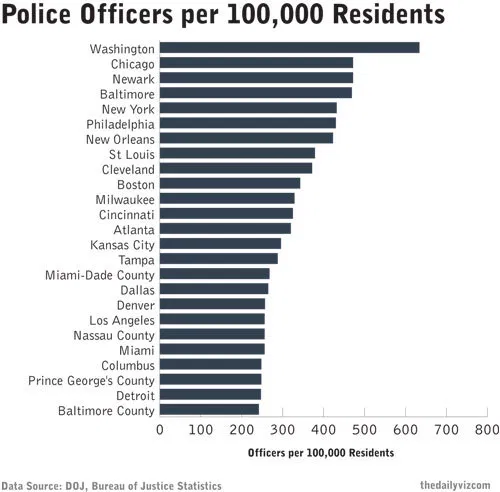
How Many Cops Does Your Local Government Have Per Resident?
Does Washington, D.C., have more cops than other cities? That’s the question I asked myself the other day after watching a patrol car drive down our quiet, residential street. I see...
Read more →
sunfoundation: Maps of the Drug War in Mexico Homicides and Trafficking Routes
[caption id="attachment_53" align="alignnone" width="620" caption="sunfoundation: Maps of the Drug War in Mexico Homicides and Trafficking Routes"][/caption]
Read more →
A Year In D.C. Homicides
HomicideWatch D.C. charted 2011 homicides late last month. This is a great batch of data, all hand collected by Laura and Chris Amico.
Read more →
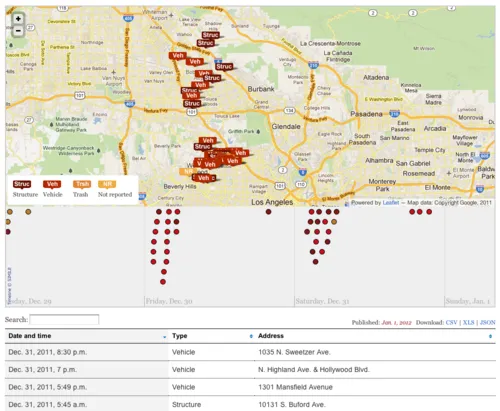
Mapping LA Fires
The Los Angeles Times has released a nifty interactive map and table of the recent arson fires in the City of Angels: Since the morning of Dec. 30, a wave of...
Read more →
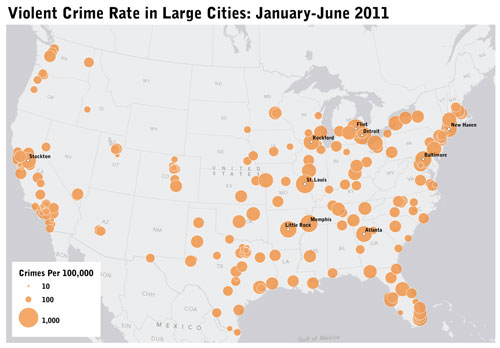
Mapping Violent Crime, Murder Rates with FBI Data
The FBI today released its mid-year crime figures from large cities around the county, and the data are positive, NPR reports: The number of violent crimes reported by 12,500 U.S. law enforcement...
Read more →