How Common Is Your Birthday? Pt. 2.

By Matt Stiles | | Topics: Demographics

Last weekend’s birthday heatmap post has been hugely popular by The Daily Viz standards, drawing in more than 100,000 readers and tons of social media attention. While I’m excited about the traffic, I’m also worried that the graphic may have misled some readers.

Some people read the map assuming that darker shades represented higher numbers of actual births, even though I tried to explain in the post that the colors were shaded by birthday rank, from 1 to 366, in popularity. Or I thought I did. Because of that, Sept. 16 — the most popular birthday — seems wildly more common than January 1, among the least popular. Both may be relatively close in the raw number of births, even though their ranks are far apart.

Unfortunately, I haven’t yet been able to acquire a list of all dates and total births for each. But last night I compiled a decade’s worth of nationwide birth data by month. Those data show that August, in fact, saw the most births during the 10-year period. Each month is over 3.1 million births, however:

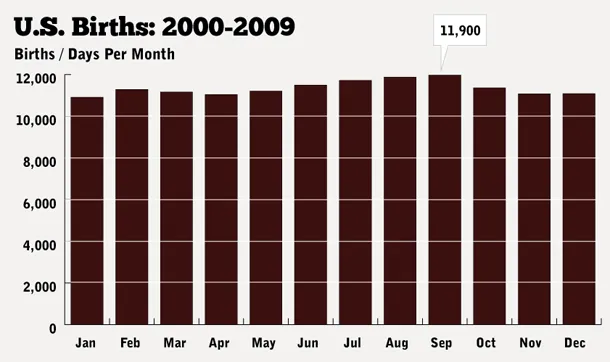
August, of course, has an extra day for potential births, so I created an average births by month field. Viewed that way, September did have more births relative to its size. But notice there isn’t much difference between months in the distribution of the births. Alas, all our birthdays are probably pretty normal:

I should note that this blog is a place for me to experiment with visualization techniques in my own time, and I will occasionally make bad design choices or produce work that is less useful to some. This is one of those times, I suppose. Thanks to Dan DeFelippiWaldo Jaquith and several others who prompted this post. Download the data if you want to create your own visualizations.

Data source: Centers for Disease Control, National Vital Statistics Reports

10 thoughts on “How Common Is Your Birthday? Pt. 2.

  1. I don’t get it… in the other post you say the data is number of babies born on each date, but here you say it is not higher numbers of actual births, but popularity. Could you explain the difference?

  2. Oh… OK, I get it, it’s not that the darker areas don’t represent higher numbers of births, but that from dark to light doesn’t really give you any info in terms of real numbers, so that maybe you could have the difference from rank 1 to rank 2 be small, but from rank 2 to rank 3 much larger, etc.

    1. Right. It’s not that the heatmap isn’t accurate, it’s just misleading and not particularly useful. My intent was to experiment with creating heatmaps. I just chose the wrong data set. Sorry for the confusion.

  3. The real problem is that people blogged it / tweeted it / shared it/ etc. without realizing that obviously with a sample size of potentially 6B, there’s no way logically to explain high variations in days.

    Blindly sharing without any real logical thought.

  4. I think one of the main problems with the heat map is that neither the blog post nor the image file itself has any clarification about what data source was being used. Now internet users worldwide are assuming that the data is valid for their country. This is obviously not the case. In Sweden, it’s well known that the number of births is much higher during the spring than any other part of the year.

    1. I don’t normally get readers from outside the United States, so that’s why it’s not included. I had no idea this would get wide attention. As I’ve said, this blog is a sandbox for me to experiment with data visualization. Obviously this was a learning experience, but I also don’t think I need to apologize for ever nit picky comment about a graphic I made in 30 minutes on a Saturday afternoon at home.

Comments are closed.