Sketching D.C. Crime Data With R
A car burglar last week nabbed a radio from our car, prompting me to think (once again) about crime in Washington, D.C., where I live.
I wanted to know if certain crimes were more common in particular neighborhoods, so I downloaded a list of every serious crime in 2012 from the city's data portal. The data contained about 35,000 reported incidents of homicides, thefts, assaults, etc., with fields listing the date, time and neighborhood associated with each case.
I used the statistical programming language R, which is great for quickly creating small multiples to examine data, to make some rough visual sketches.
First, since we're talking about cars, the first grid shows thefts from vehicles, by hour and "advisory neighborhood commission". These commissions are the small groups of officials who represent their respective D.C. neighborhoods on issues like real estate development and alcohol sales, among other things. (I live in Brookland, which is governed by ANC 5B). You can find your ANC here.
It's clear that thefts from vehicles are most common in ANC 1B, a diverse, densely populated and rapidly changing section of the city. For those familiar with D.C., this is Shaw, U Street and parts of Columbia Heights. The x-axis shows the hour of the crime, and the y-axis shows the total number of crimes. My neighborhood is relatively safe, actually:

Next we look at robberies, which appear common in ANC1A, which also contains Columbia Heights and Park View. Notice the spikes in the early-morning hours in the ANCs 1A and 1B, compared to the late-night spikes in ANCs 8B and 8C, both of which are in the far southeast neighborhoods like Anacostia and Buena Vista. These are among the poorest areas in the city. I'm not sure what that means, but it's interesting:

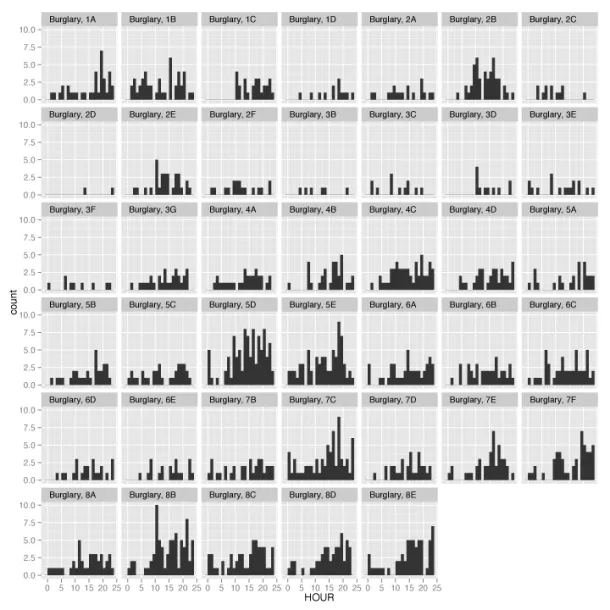
Burglaries...

Car thefts...

Assaults with dangerous weapons...

Here are the homicides — all of which get coded as occurring at midnight, so we don't get to distribution by hour. Still, the result is a simple bar chart that shows the variance by region (7D and 8E had more homicides last year than other locations).

Here's the grid with all these crimes above (also including a small number of arson cases):

And here's a grid with histograms for each offense type. Simple thefts (there were more than 12,000 last year) appear to be most commonly reported in the afternoon, while thefts from vehicles are most often reported first thing in the morning — probably because victims notice the crime when they wake up.

Again, these are just quick sketches, but they show you the power of R in exploring your data before investing time in a more complicated visualization. A look at the basic code also shows how quickly these types of sketches can happen.
Previously: