Charting MLB Division Races
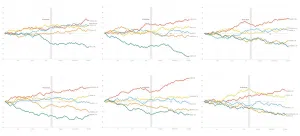
Earlier I used small multiples to show how each Major League Baseball team's 2016 season progressed relative to the .500 line. Here are those same line charts, but this time I've grouped them by division:
Earlier I used small multiples to show how each Major League Baseball team's 2016 season progressed relative to the .500 line. Here are those same line charts, but this time I've grouped them by division: