Posts tagged "3-D"
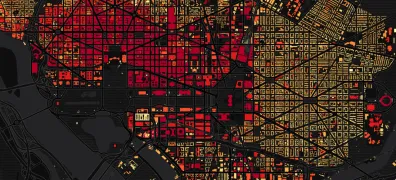
Mapping D.C. Building Heights
I posted yesterday about residential buildings in Seoul and South Korea. Here's a quick look at the buildings in my previous city, Washington, D.C. Darker shades represent taller buildings:
Read more →
Trulia's Growth Spikes
The data-driven real estate service Trulia.com has released another cool visualization — this time mapping the company’s growth in web traffic since August 2006. The map illustrates where house hunters...
Read more →
2010 Census: U.S. Population by County in 3D
Yesterday’s Census maps — in 3D. Color shades represent growth rates. Extrusions represent raw population changes.
Read more →
Pigs, Cows, Chickens: A Map
Inspired by Bill Rankin’s maps, I downloaded the U.S. Census of Agriculture, which counted the number of food animals sold and moved off farms in each American county during the 2007...
Read more →