Posts tagged "Bar Charts"
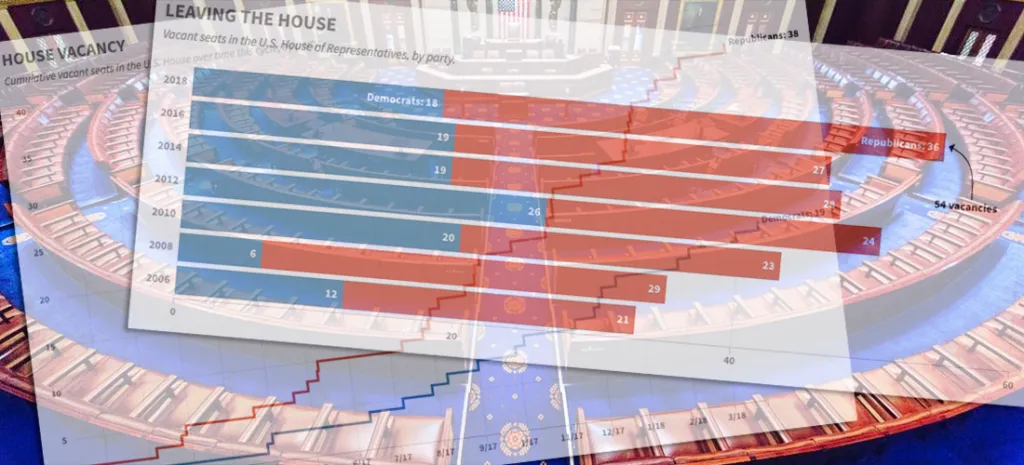
Charting the GOP's Congressional Exodus
Another Republican in the U.S. House — Speaker Paul Ryan, no less — announced his intention not to seek re-election in 2018, adding to the number of members leaving ahead of what's...
Read more →

Visualizing the News Nerd Conference Known as #NICAR18
I'm in the United States this week to attend the annual news nerd conference known as NICAR, a diverse gathering of reporters, editors and developers (and others) focused on storytelling...
Read more →
Who's Competing at Pyeongchang? A Breakdown By Sports, Nations, Genders
More than 2,900 athletes from 92 nations and territories are competing in the Winter Olympics in Pyeongchang, South Korea. The event has 15 different sports (and many events within each)....
Read more →
How Do We Solve North Korea? Yonsei University Students Have Ideas.
I gave a guest lecture today to an East Asian international relations course at Yonsei University in Seoul. As part of the class, the more than 40 students participated in...
Read more →

North Korean 'Provocations' Freeze During Winter?
Last week I posted a visual timeline highlighting nuclear, missile and other "provocations" by the North Korean regime since 2006. The data show a clear escalation, especially in missile tests,...
Read more →
Charting Views On The 'Fiscal Cliff'
The Washington Post charts the results of its new poll: In addressing the fiscal cliff, the public supports increasing taxes on the wealthy but have mixed views of changing federal...
Read more →
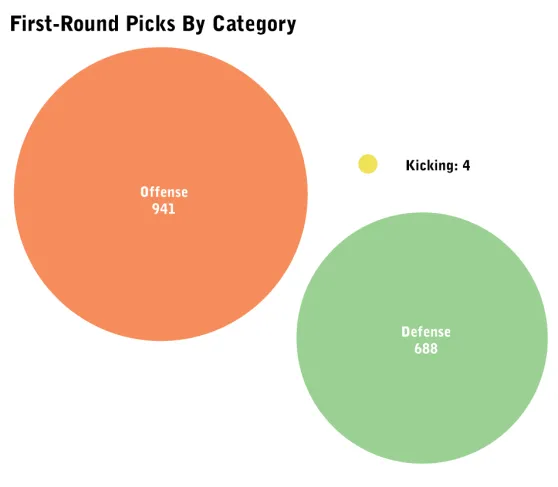
Charting First-Round NFL Draft Picks
More than 1,600 players have been selected in the first round of the NFL draft since 1936, according to league statistics. These charts break down the choices made by NFL...
Read more →