Posts tagged "R"
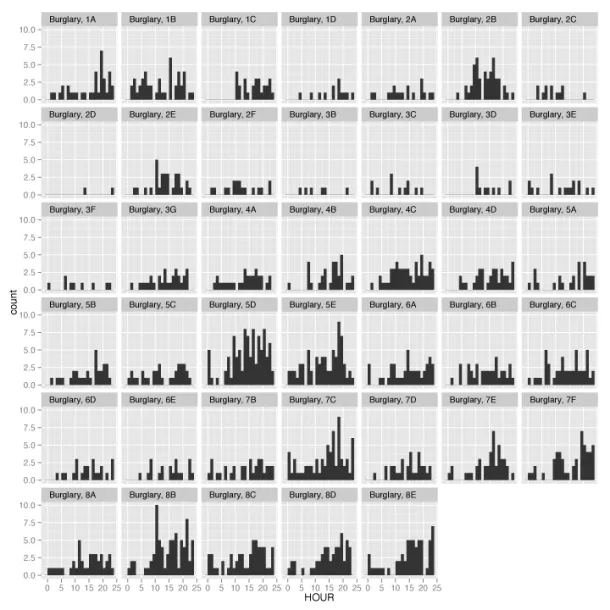
Sketching D.C. Crime Data With R
A car burglar last week nabbed a radio from our car, prompting me to think (once again) about crime in Washington, D.C., where I live. I wanted to know if...
Read more →
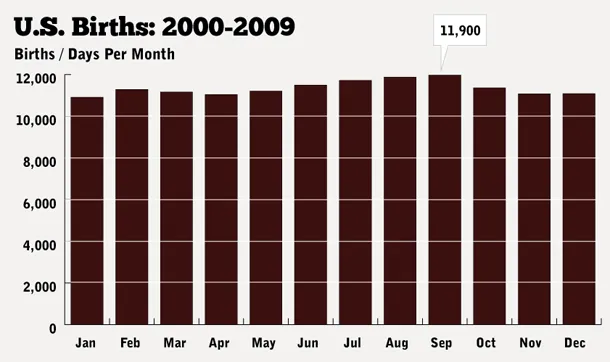
How Common Is Your Birthday?
UPDATE: I've written a clarification about this post here. Please read it. A friend posted an interesting data table on my Facebook wall yesterday, which was my birthday. The data...
Read more →
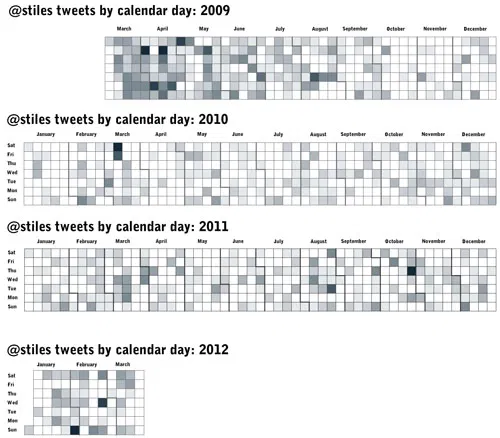
Use Calendar Heat Maps to Visualize Your Tweets Over Time
Following Nathan Yau’s excellent tutorial for creating heat maps with time series data (he used vehicle accidents by day for a year), I visualized 3,559 of my tweets back to...
Read more →
Charting Marriage, Education
Lately I’ve been experimenting with bubble charts in R based on Nathan Yau’s great tutorial. In this case, I wanted to see the relationship between higher education and marriage among...
Read more →
Another View of ONA
Yesterday I posted a map that used proportional symbols to visualize the home cities of Online News Association conference attendees. Today’s version uses great circles to map the routes attendees...
Read more →