Posts tagged "who"
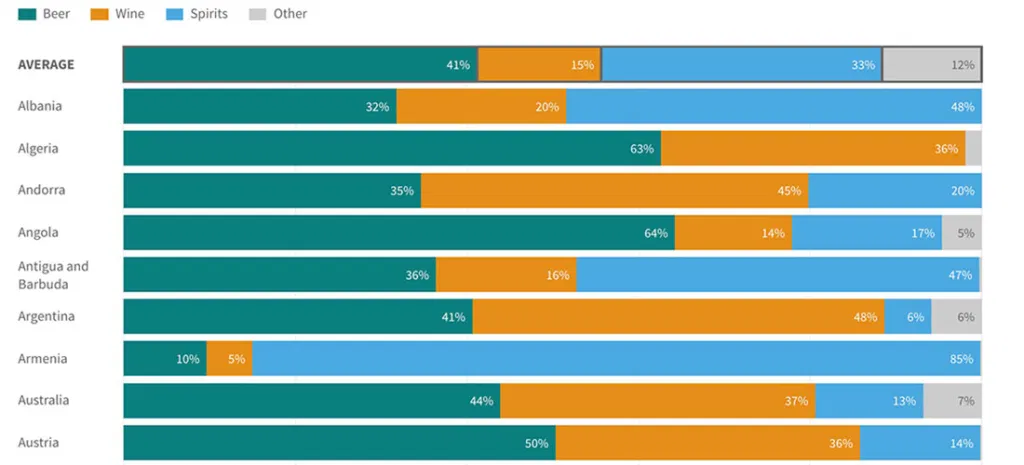
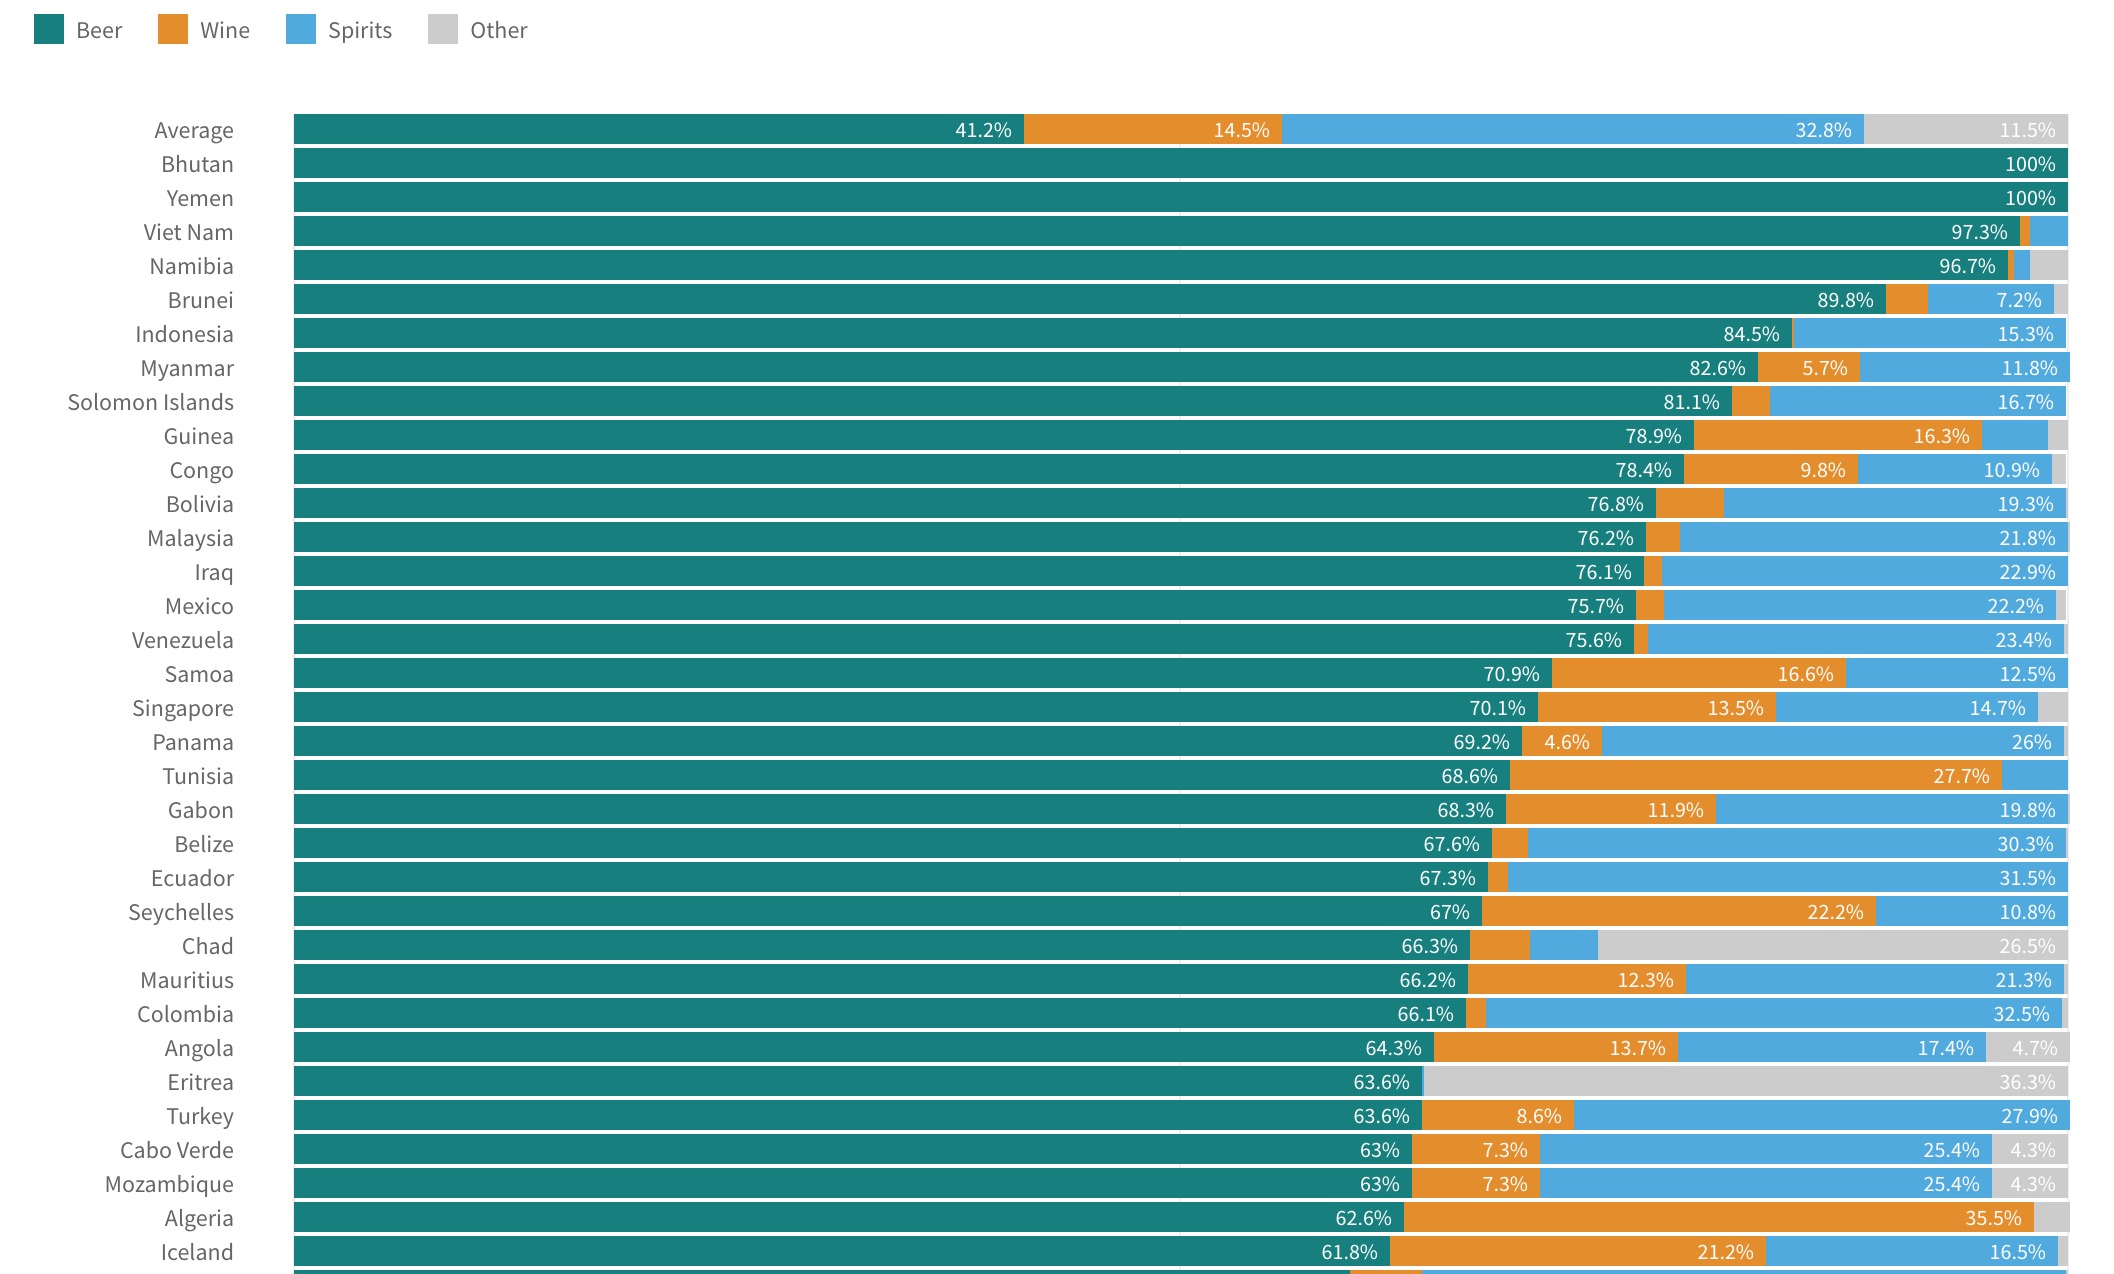
Visualizing World Alcohol Consumption: What Beverages Do Countries Prefer?
I posted recently about how countries consume different amounts of alcohol — and how some have wider gender gaps when it comes to booze. The previous posts relied on two...
Read more →
Visualizing World Alcohol Consumption: How Much Does Each Country Drink?
A few weeks ago I posted about gender gaps in alcohol consumption around the world. In some countries — South Korea, for example — men and women consume quite different amounts...
Read more →
How Much Differently Do Men and Women Drink Alcohol — By Country
A few months ago, I wrote about the novelty of a McDonald's selling beer at one of its restaurants in South Korea — a first for the fast-food giant in...
Read more →