Visualizing Foursquare, Pt. 2
This morning I posted a quick map illustrating my 1,100 check-ins on Foursquare during the last two years. I made it using TillMill, an open-source application for creating interactive map tiles.
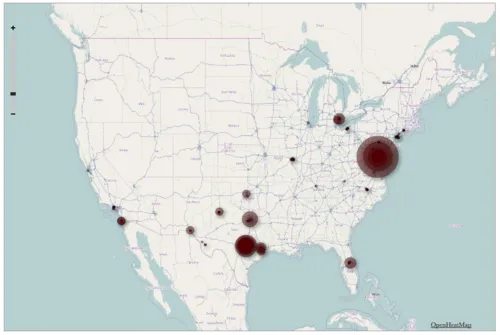
This version was made in OpenHeatMap (larger symbols represent more check-ins). Clearly my Foursquare usage increased after I moved from Austin to DC last year:

Thanks to Pete Warden, who created the tool. He helped me structure my field headers so the application would recognize the geo data for each check-in. Documentation here.
PREVIOUSLY: