Mapping Crime Data With CartoDB
Today I started playing with CartoDB, an online data mapping service that reminds me in some ways of both Google Fusion Tables and TileMill.
To start, I grabbed a simple test data set — five months of geocoded major crimes in D.C. from January to May this year — to check out some features. One I like is allowing users to query their data in the browser-based interface and filter for specific types of records.
Here, for example, I narrowed the map to show just thefts:

Assaults with deadly weapons:

Vehicle thefts:

Thefts from vehicles:

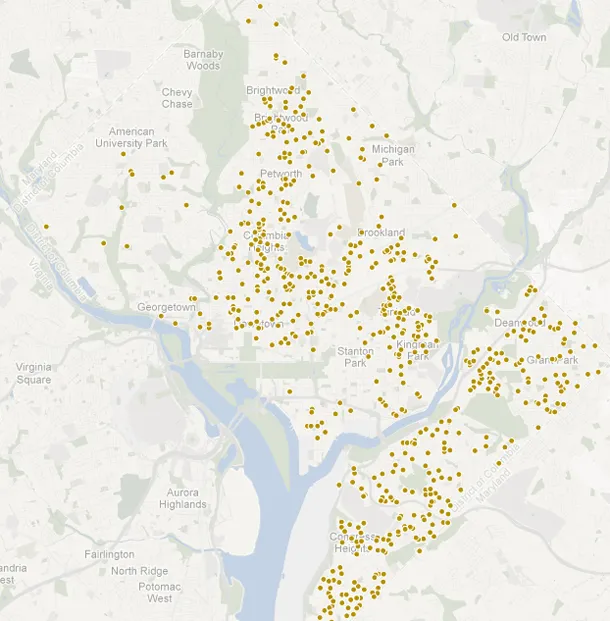
Robberies:

Homicides:

I made these maps in less than five minutes, so I'm sure there are much more useful stories to tell with the tool. There are also many, many features I didn't explore, like the ability to style the map using Carto, the CSS-like language, rather than the UI.
Anyway, give it a shot, and let me know what you build.