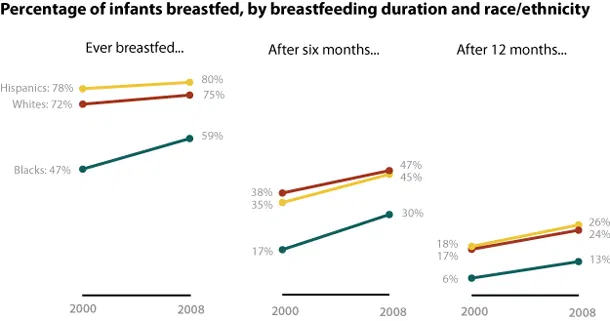
U.S. Breastfeeding Rates By Duration, Race/Ethnicity Over Time
Early this month, the Centers for Disease Control released a study analyzing breastfeeding in America, noting that the percentage of babies who were breastfed increased by four points from 2000 to 2008.
But the study showed that less than half of women were still breastfeeding after six months,...
Read more →

Charting Inaugural Speech Lengths
President Obama began his second term today with a roughly 2,000 word inaugural speech at the Capitol. How does the length of his remarks compare with other presidents in history?
Data source: Wikipedia
Read more →
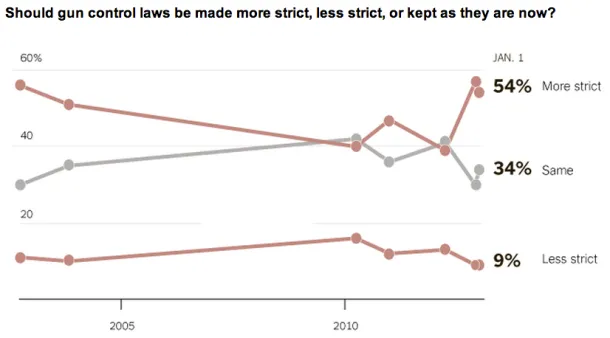
Charting Views On Gun Control
The latest New York Times/CBS News poll shows support among Americans for stricter gun control laws:
The massacre of children at an elementary school in Newtown, Conn., appears to be profoundly swaying Americans’ views on guns, galvanizing the broadest support for stricter gun laws in about a d...
Read more →
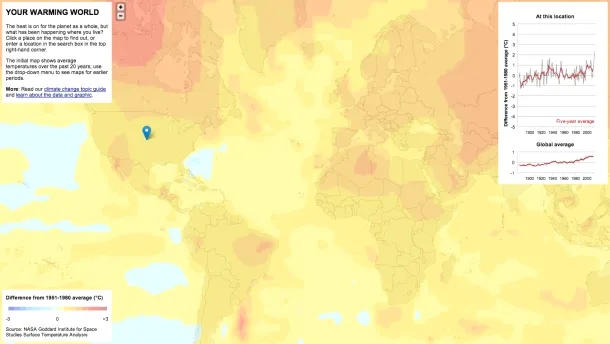
Mapping 'Your Warming World'
New Scientist has published a fascinating interactive map related to increasing global temperatures over time:
The graphs and maps all show changes relative to average temperatures for the three decades from 1951 to 1980, the earliest period for which there was sufficiently good coverage for co...
Read more →
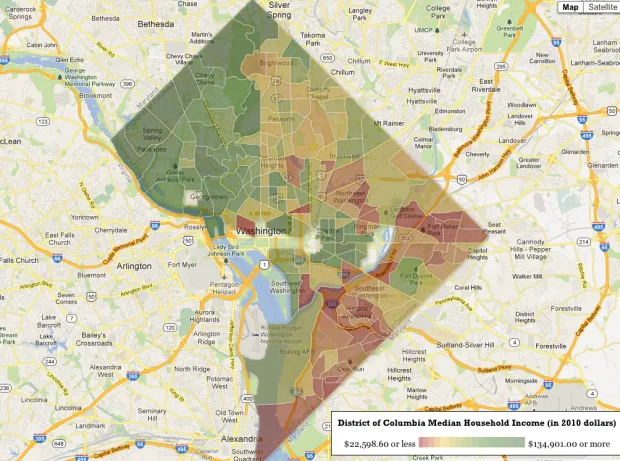
Mapping 'Rich Blocks, Poor Blocks'
"Rich Blocks, Poor Blocks" allows users to get information about income in their neighborhoods, using the 2006-2010 American Community Survey estimates* compiled by the U.S. Census Bureau. Here's a map of Washington, D.C., which — as I've noted before — is segregated by race, educational attain...
Read more →
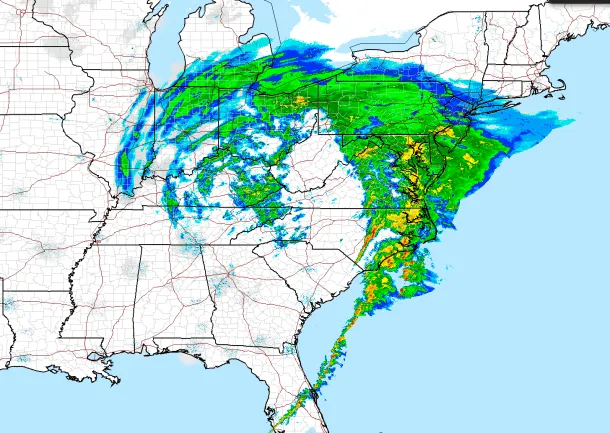
Mapping The White (Day After) Christmas
Here in D.C. we woke today to a surprise coat of snow/sleet, the first significant wintry mix of the season. Apparently, the precipitation came from a massive storm that's dumped rain and snow — and sparked tornados — over a large swath of the country. The National Weather Service has a fancy (...
Read more →
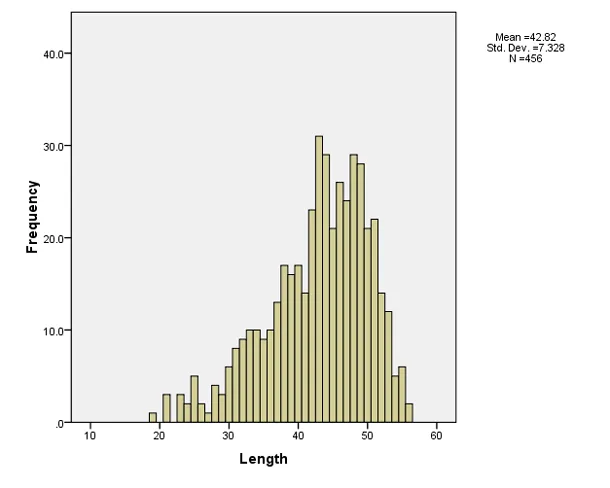
Charting Missed Field Goals
Earlier today, Kansas City Chiefs kicker Ryan Succop missed a 27-yard field goal in the first quarter against the Cleveland Browns, prompting the announcer to say something to the effect of, "You don't see many field goals missed from that distance."
That's true.
This histogram shows the nearly...
Read more →
Charting Views On The 'Fiscal Cliff'
The Washington Post charts the results of its new poll:
In addressing the fiscal cliff, the public supports increasing taxes on the wealthy but have mixed views of changing federal income tax deductions and are opposed to changing Medicare.
[caption id="attachment_1237" align="alignnone" width=...
Read more →
Mapping Obama's Election Performance By County In 2012 Vs. 2008
The Washington Post over the weekend published an interesting story about President Obama's southern support in the election:
The nation’s first black president finished more strongly in the region than any other Democratic nominee in three decades, underscoring a fresh challenge for Republican...
Read more →
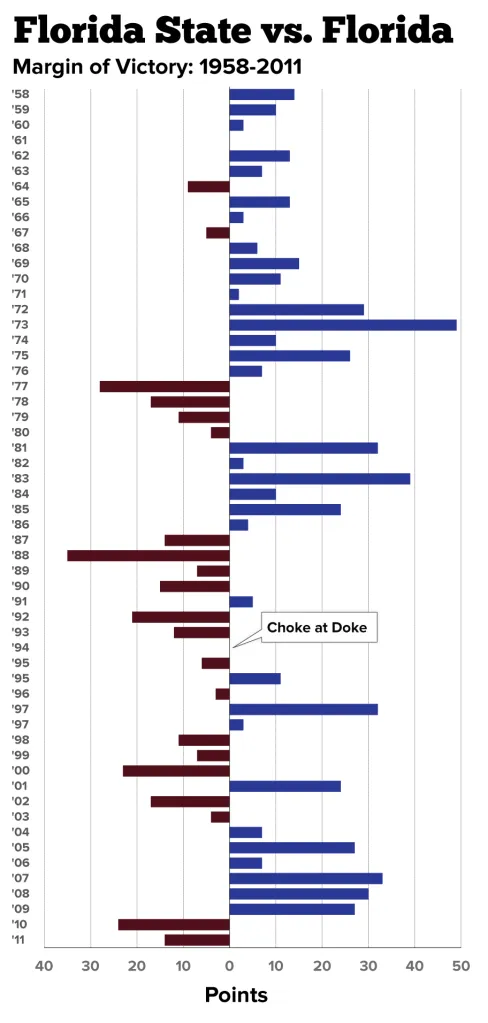
Charting the FSU-Florida Rivalry
As a kid growing up in Tallahassee, I both cherished and dreaded the Florida State vs. Florida rivalry. As a 'Noles fan, the game too often ended in defeat, occasionally dashing my team's national title hopes.
But I'll always remember the best game of the rivalry — the 1994 "Choke at Doke" — i...
Read more →