Posts tagged "DC"

Chart: If Ousted, Jeff Sessions Would Have a Historically Short Tenure
If President Trump decides after all to replace Attorney General Jeff Sessions, who was approved just 166 days ago, the former Alabama senator would have one of the shortest tenures...
Read more →
Someday I'll Say Goodbye to Seoul. I Might Miss the Weather.
Note: I followed my wife, a foreign correspondent for NPR News, to Seoul last year. This is one of a series of posts exploring our adopted country's demographics, politics and...
Read more →
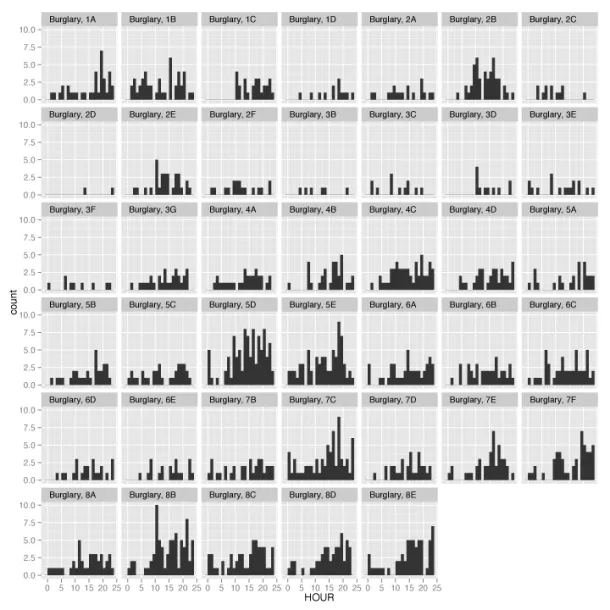
Sketching D.C. Crime Data With R
A car burglar last week nabbed a radio from our car, prompting me to think (once again) about crime in Washington, D.C., where I live. I wanted to know if...
Read more →
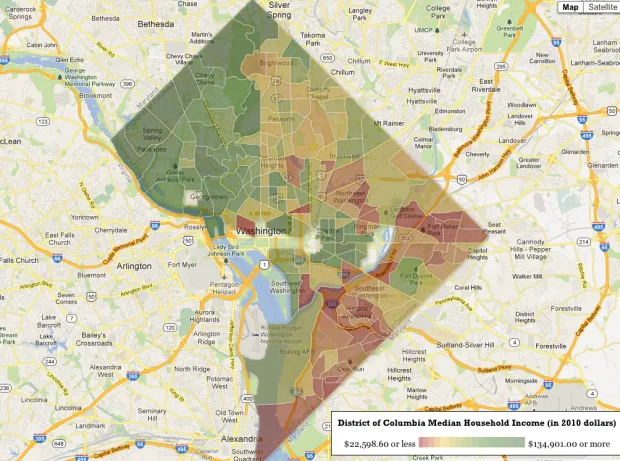
Mapping 'Rich Blocks, Poor Blocks'
"Rich Blocks, Poor Blocks" allows users to get information about income in their neighborhoods, using the 2006-2010 American Community Survey estimates* compiled by the U.S. Census Bureau. Here's a map...
Read more →
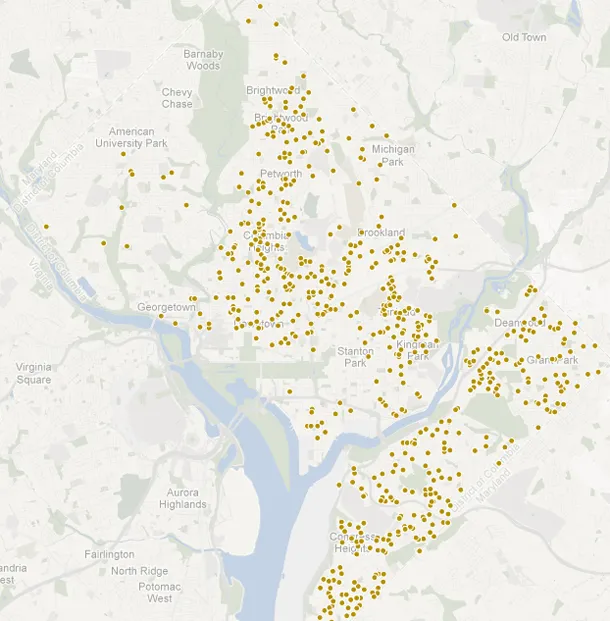
Mapping Crime Data With CartoDB
Today I started playing with CartoDB, an online data mapping service that reminds me in some ways of both Google Fusion Tables and TileMill. To start, I grabbed a simple...
Read more →
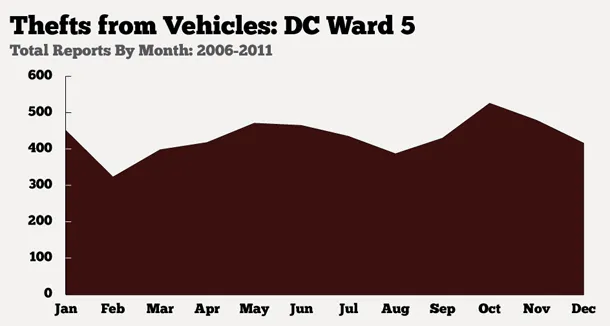
Charting Car Burglaries in DC
Last week someone burglarized our car. Fortunately the burglar didn't get much, if anything, and a window wasn't smashed. (Someone left the door unlocked, apparently). But it was a reminder...
Read more →
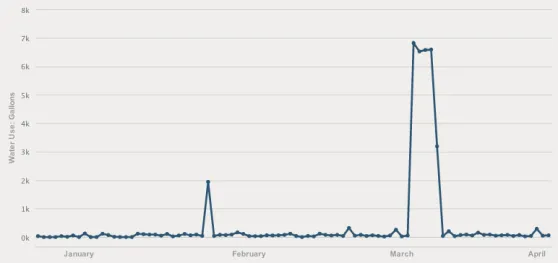
Charting Our Nightmare Water Bill
The folks at DC Water have had trouble updating our account since we closed on a new house in January. They figured it out recently, though, and we got a...
Read more →
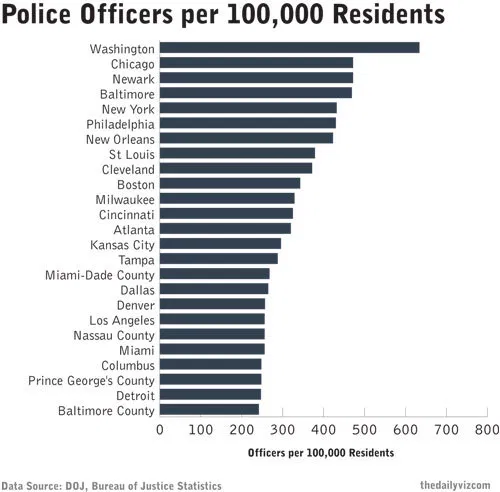
How Many Cops Does Your Local Government Have Per Resident?
Does Washington, D.C., have more cops than other cities? That’s the question I asked myself the other day after watching a patrol car drive down our quiet, residential street. I see...
Read more →
A Year In D.C. Homicides
HomicideWatch D.C. charted 2011 homicides late last month. This is a great batch of data, all hand collected by Laura and Chris Amico.
Read more →
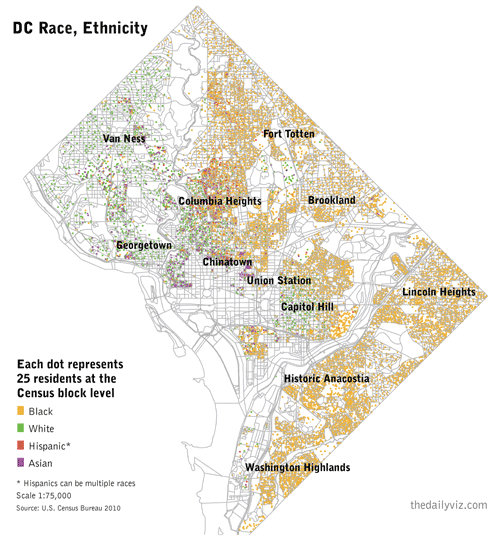
A 'Radical' View of DC's Demographics
I’ve been obsessed with William Rankin’s ‘radical cartography’ site for more than a year. One map in particular — a detailed view of Washington, D.C.’s segregated neighborhoods — has stuck...
Read more →
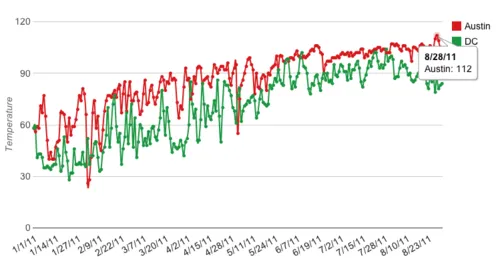
DC vs. Austin Weather: Part 2
Back in May I compared the weather in my former town, Austin, Texas, to my current home, Washington, DC. Now that I’ve lived through a summer here, I’ve revisited the...
Read more →
'Hunkered Down' With Some DC Hurricane History
Using the NOAA’s cool hurricane tracker, I discovered that Washington, DC, hasn’t received a direct hit from a hurricane in recorded history. (And, of course, Hurricane Irene won’t pass directly...
Read more →
Charting DC 311 Calls
The D.C. government fielded nearly 430,000 service requests via 311 last year, according to records available in the city’s open data directory. Residents asked to have potholes filled, snow and...
Read more →
Mapping D.C. Schools
UMBC professor Lou Paladino made this interesting map that visualizes academic performance by Washington, D.C., school districts. Darker cool colors represent higher scores; darker warm colors represent lower scores. This...
Read more →
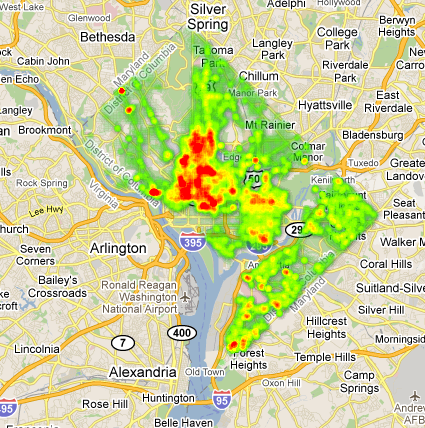
D.C. Crime Heat Map
Yesterday I posted some thematic maps showing D.C. population and crime by political ward. Here’s that same 2008-10 crime data — more than 100,000 murders, robberies, burglaries, thefts and other...
Read more →
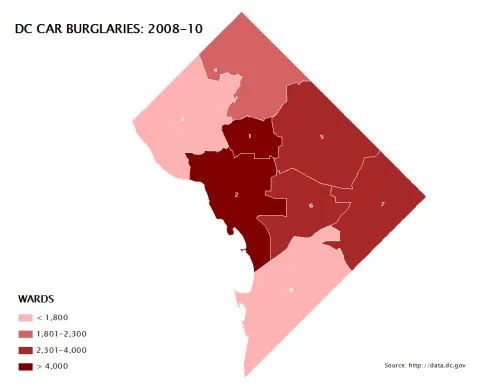
D.C. Population, Crime by Political Wards
I’ve posted before about crime in Washington, D.C., a city I’m still working to understand demographically and geographically. Here are some maps I made this morning as part of that process. First,...
Read more →
In the Suburbs, I...
… should be buying gas, according to this map of D.C.-area gas prices. The lowest, in Maryland, are about $3.70 per gallon of regular gas. (The D.C. average is more...
Read more →
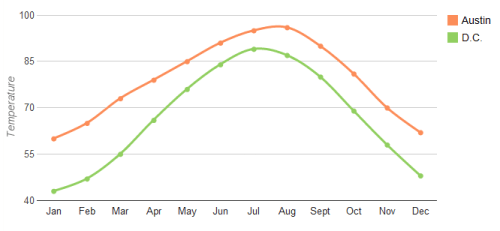
DC vs. Austin Weather
I love Austin, but my biggest complaint about Texas’ capitol city is the oppressive summer heat. And when I say summer, I mean April to October. Today’s high temperature is...
Read more →
D.C. Census Drops (Finally)
The U.S. Census Bureau today released redistricting data for the District of Columbia, a city that at first glance remains quite segregated — at least in terms of where people...
Read more →
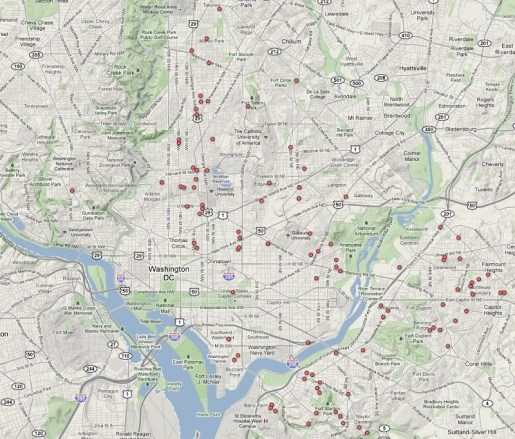
D.C. Homicides
The Washington, D.C., official data catalog is a rich source for information about the nation’s capitol. Users can download dozens of free GIS products as well as datasets related to city...
Read more →