Posts tagged "electoral college"
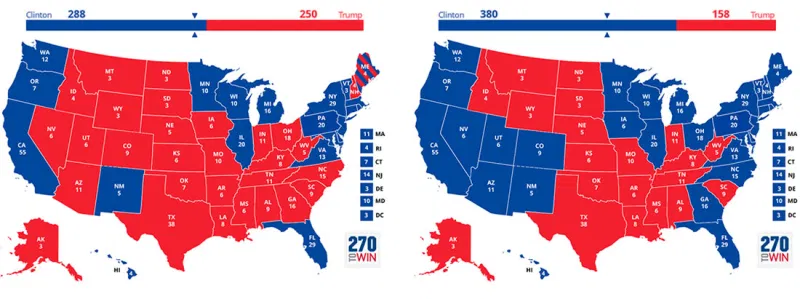
FiveThirtyEight Chat On Maps: Turning The "Big" States Blue
The folks at FiveThirtyEight had a fun data visualization discussion during their regular election chat this week, about whether Hillary Clinton should focus on ensuring victory next month or spending...
Read more →
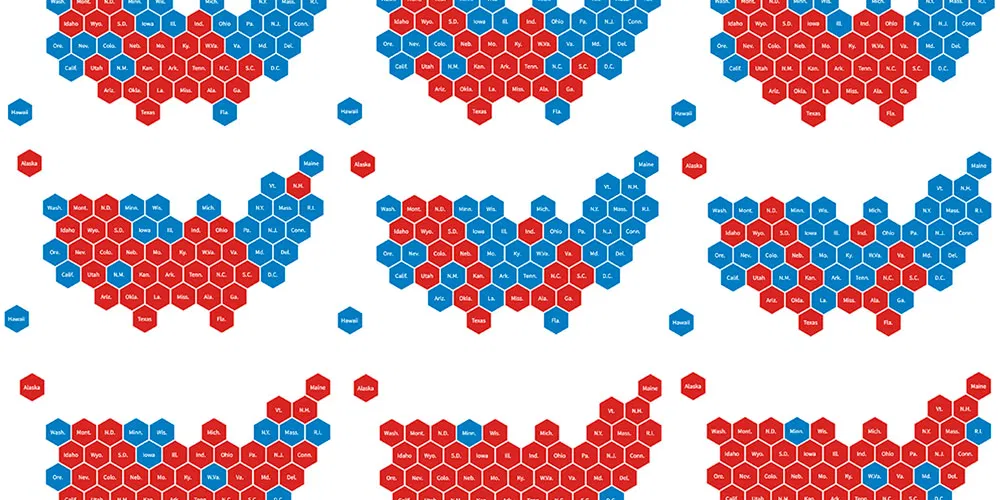
Let's Tess(t)ellate: The Electoral College in Tile Grid Maps, 1980-2012
I recently added some new charting tools here thanks to NPR's excellent daily graphics rig, which we used recently to compare air quality in Seoul with other large cities. There's...
Read more →