Mapping Wildfire Danger
Our latest work project transforms the static federal wildfire danger forecast into an interactive map. We released it today:
Users can view the full country map or find their location to see burning conditions in their area, in this case Carthage, Missouri:
And it works on a smart phone or ...
Read more →
Mapping VP Birthplaces
If elected, Republican Paul Ryan would be the first vice president from Wisconsin. Here's where the 47 men who've held the office were born, according to data on Wikipedia:
Download the data
Read more →
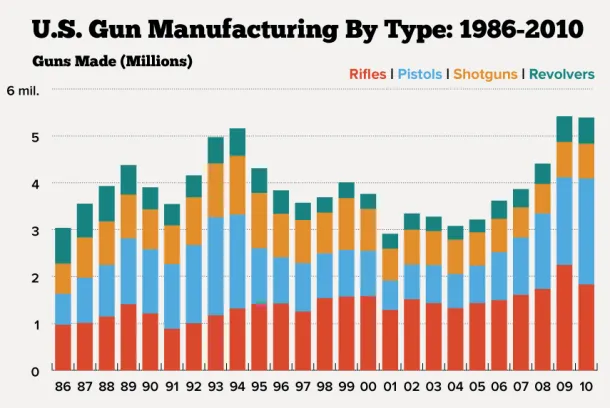
Charting U.S. Gun Manufacturing
More than 5 million guns were made in the United States in 2010, according to the latest data available from the U.S. Bureau of Alcohol, Tobacco, Firearms and Explosives, among the highest in recent history. See the trend in this quick column chart:
Download the data
Read more →
Charting Tweets At #UNITY12
Last week I attended the UNITY journalism conference in Las Vegas, and during my stay I ingested more than 9,000 tweets that had the #UNITY12 hashtag. This line chart shows how the traffic ebbed and flowed each day:
As of dinnertime Saturday, when I stopped collecting the tweets, these attende...
Read more →
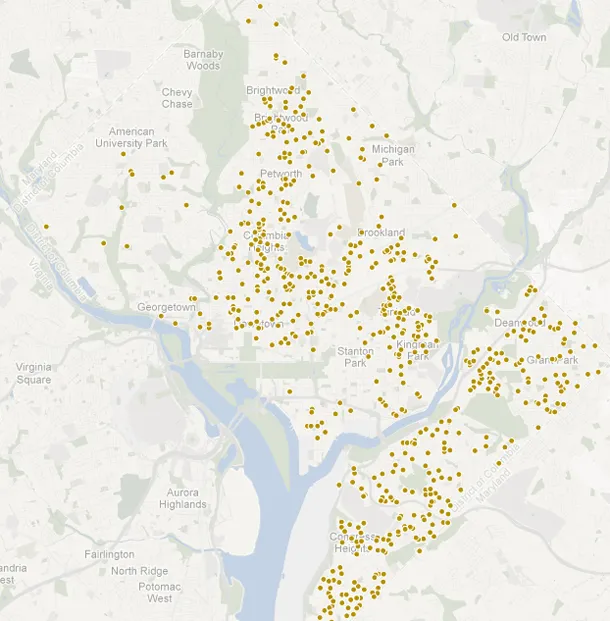
Mapping Crime Data With CartoDB
Today I started playing with CartoDB, an online data mapping service that reminds me in some ways of both Google Fusion Tables and TileMill.
To start, I grabbed a simple test data set — five months of geocoded major crimes in D.C. from January to May this year — to check out some features. One ...
Read more →
Tracking Worldwide HIV Infections
This week Washington is hosting the International AIDS Conference, and one of my colleagues crafted this interactive to show how HIV infection rates differ by country and region.
According to STDAware, the red lines below show the percentage of the adult population infected with the disease in...
Read more →
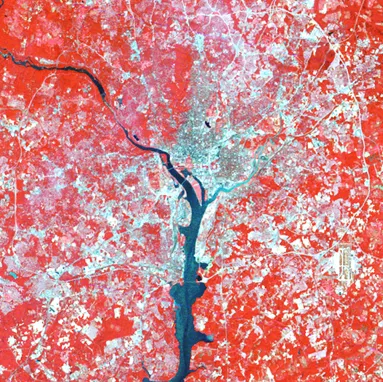
Monitoring D.C.'s Growth With Landsat
Yesterday was the 40th anniversary of the Landsat system, a group of satellites that offer scientists a continuous view of the earth.
"The data from the satellites provide a permanent, objective record of land conditions and are routinely used to measure and monitor changes brought on by natura...
Read more →
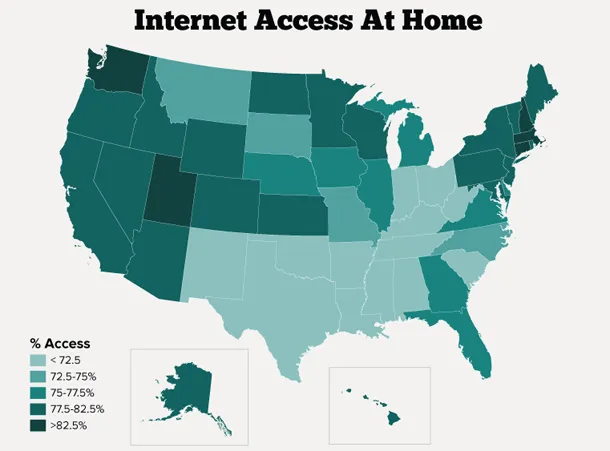
Mapping Internet Access In U.S. Homes
About three quarters of Americans have access to the Internet at home, according to a new survey released this week by the U.S. Census Bureau.
New Hampshire, Washington and Utah top the list, with more than 82 percent of their residents having Internet access. New Mexico, Mississippi and Arkan...
Read more →
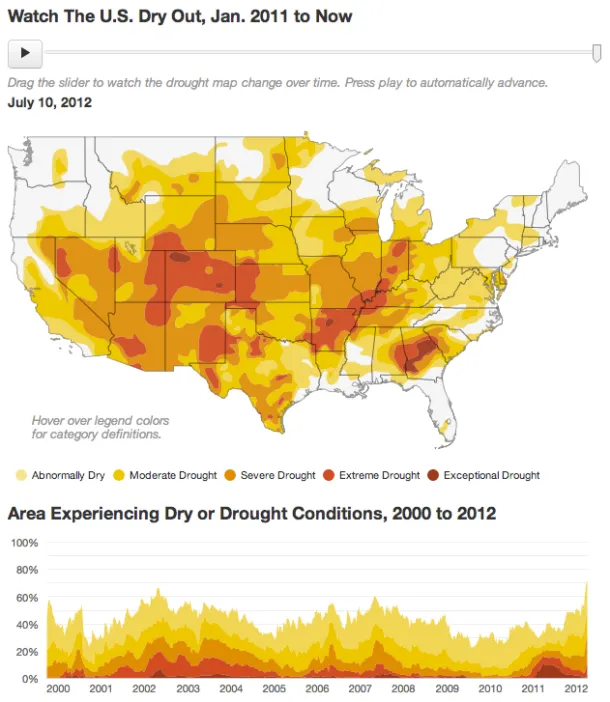
Mapping The U.S. Drought
A viz from work:
Texas experienced its worst drought on record last year. Now that the state is seeing some relief, drought conditions have consumed more than half the United States. Use this interactive map and chart to see how conditions have changed over time.
Read more →
Charting Presidential Mascot Races — And Teddy's Odd Inability To Win
Washington Nationals fans have all seen the spectacle, the fourth-inning "race" featuring the Mount Rushmore mascots: George Washington, Thomas Jefferson, Abraham Lincoln and Theodore Roosevelt. They trot around the stadium wearing period costumes and huge caricature masks. Hilarity ensues.
The...
Read more →