How Common Is Your Birthday? Pt. 2.
Last weekend's birthday heatmap post has been hugely popular by The Daily Viz standards, drawing in more than 100,000 readers and tons of social media attention. While I'm excited about the traffic, I'm also worried that the graphic may have misled some readers.
Some people read the map assumin...
Read more →
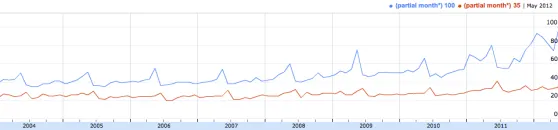
Is Mom More Important Than Dad?
Perhaps mom is more important online, at least according to Google's Insights for Search. This chart shows search volume in the United States over the years for the words "mother" and "father," suggesting that more people online want information about mothers:
Here's a similar chart for "mothe...
Read more →
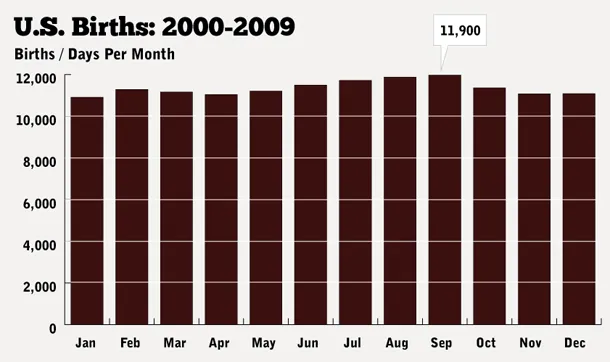
How Common Is Your Birthday?
UPDATE: I've written a clarification about this post here. Please read it.
A friend posted an interesting data table on my Facebook wall yesterday, which was my birthday. The data listed each day of the year with a ranking for how many babies were born in the United States on each date from 19...
Read more →
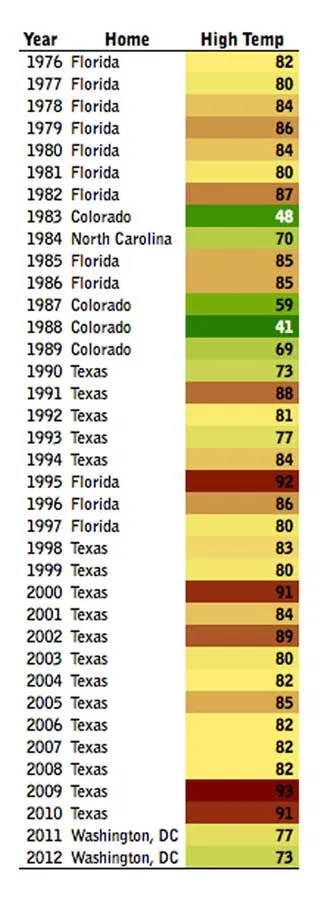
A Below-Average Birthday
Today's my birthday, and the weather is great. What's it been like for past birthdays, I wondered.
The answer: All over the place (sort of like my parents' moving choices). This quick heat map shows how the weather varied over the years, with the minimum and maximum more than 40 degrees apart. ...
Read more →
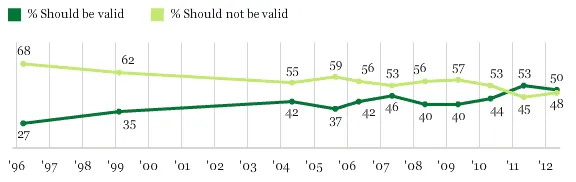
Charting Attitudes About Gay Marriage
President Obama said today that same-sex couples should be allowed to marry. Half of Americans agree, according to Gallup:
Read more →
Charting Border Agents, Apprehensions
The U.S. Border Patrol told Congress on Tuesday that the number of apprehensions along the Mexican border was at a 40-year low. The trend prompted the agency to propose a new national strategy, the Associated Press reports:
For nearly two decades, the Border Patrol has relied on a strategy that...
Read more →
Mapping The Titanic's Passengers
Mapping software giant Esri has recently published "story maps," self contained interactives in which maps anchor the narrative. The latest example uses symbols on a world map to show the destination cities of Titanic passengers. Larger symbols represent more passengers traveling to a specific ...
Read more →
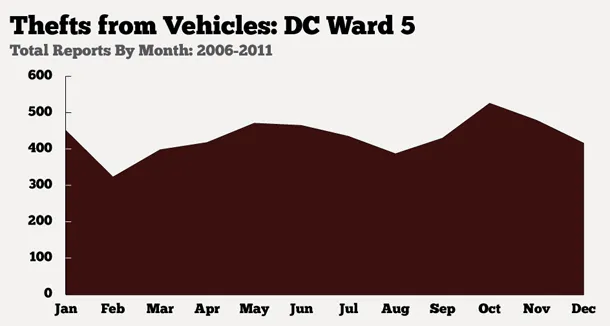
Charting Car Burglaries in DC
Last week someone burglarized our car. Fortunately the burglar didn't get much, if anything, and a window wasn't smashed. (Someone left the door unlocked, apparently). But it was a reminder that, even though our Brookland neighborhood is quiet and safe, we're still vulnerable to property crimes...
Read more →
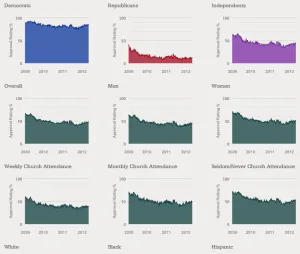
Comparing President Obama's Job Approval Rates Among Different American Groups
President Obama's approval rating has crept just above 50 percent, his best position in a year, the latest Gallup survey figures show. The Washington Examiner adds some historical context:
Obama's numbers peaked at 53 percent in the last week of May [2011], but then dipped below 50 percent in J...
Read more →
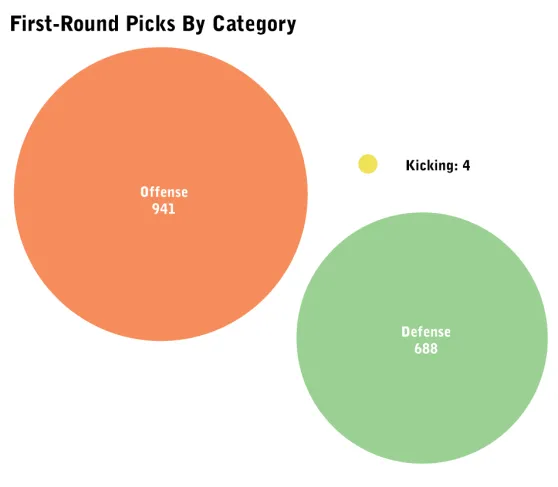
Charting First-Round NFL Draft Picks
More than 1,600 players have been selected in the first round of the NFL draft since 1936, according to league statistics. These charts break down the choices made by NFL teams by school, position and position type.
First, by school:
And by position type:
And, finally, by position:
Data sour...
Read more →