Politics
Election analysis, voting patterns, and political data stories

Visualizing Historical Political Party Identification in the Era of Trump
As many have noted, President Trump has shown a remarkable ability to maintain a strong base of support — about 40% of the voters — despite the myriad controversies swirling around him....
Read more →
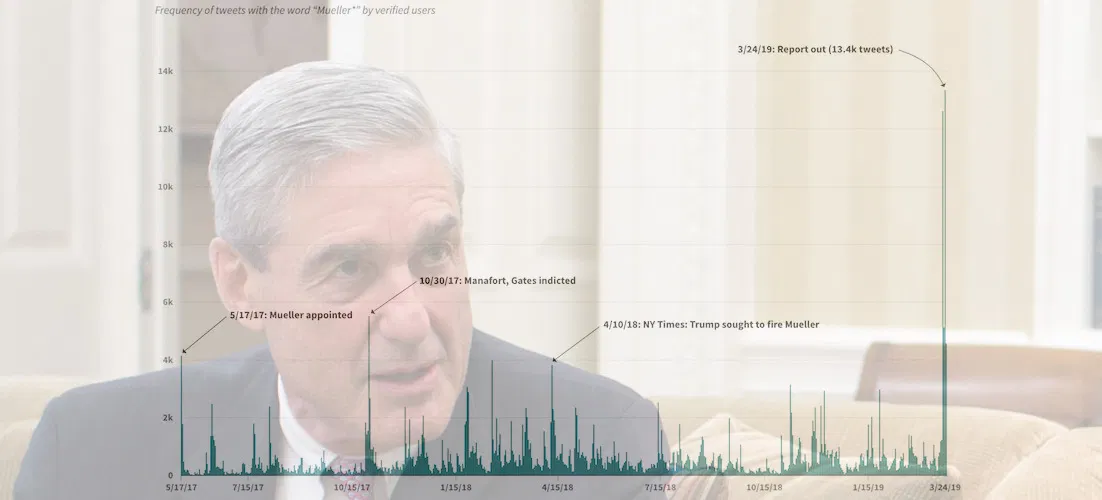
Visualizing Verified Twitter's Reaction to Robert Mueller's Investigation
Special Counsel Robert Mueller's now-concluded investigation into the Trump campaign and Russian influence over the 2016 presidential election was obviously a hot topic on Twitter. More than 400,000 tweets — an...
Read more →
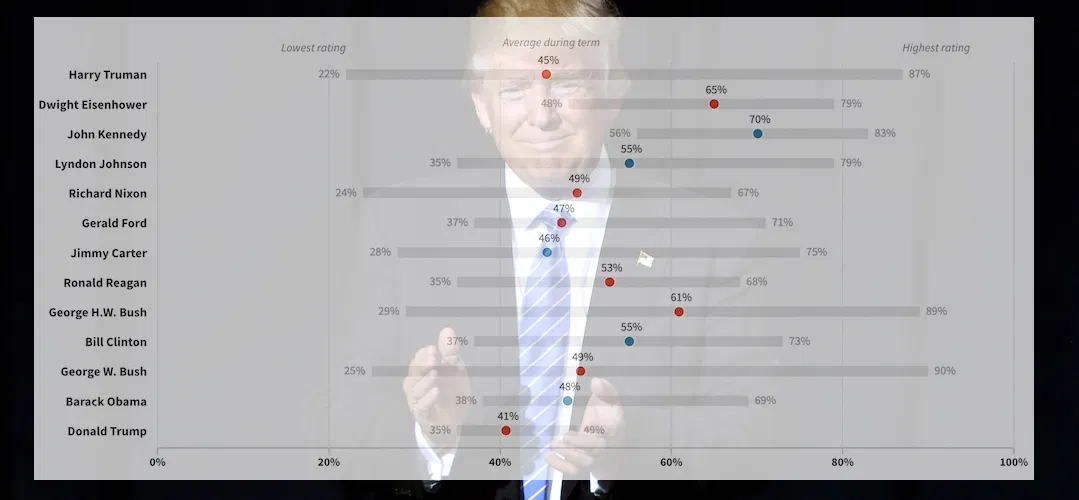
Trump's Approval Ratings are Resilient. How Does that Compare Historically?
Despite all the controversy attached to his presidency, Donald Trump has managed to retain a relatively consistent approval rating in the last two years — especially when compared to predecessors in...
Read more →
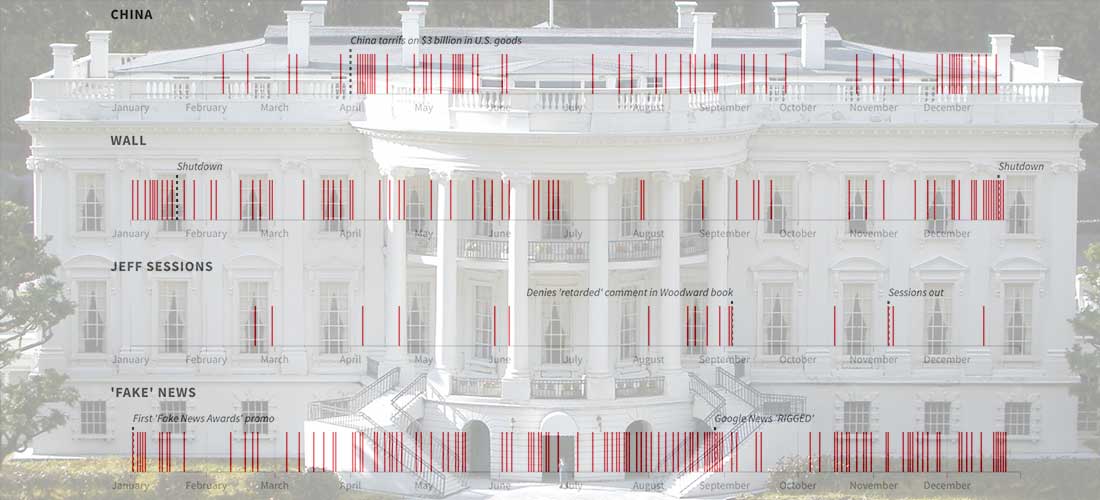
Visualizing a Year of @realDonaldTrump
President Trump thumbed his way through another year in the White House on Twitter, compiling a good (great) collection of 2,930 touts, complaints, defenses and rants. He left 2018 with...
Read more →

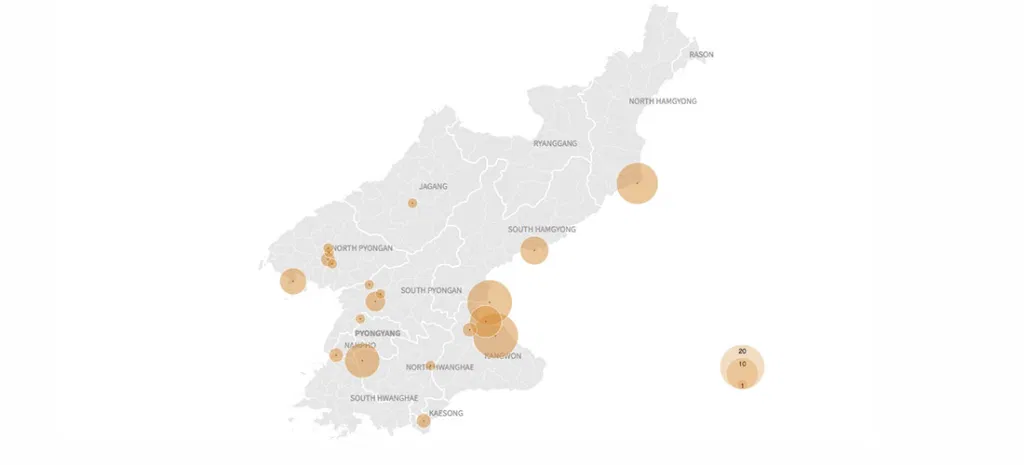
Charting the Korean War's Missing Troops
I wrote recently about the effort to get North Korea to return some of the remains of United States troops who are still unaccounted for since the Korean War. More...
Read more →
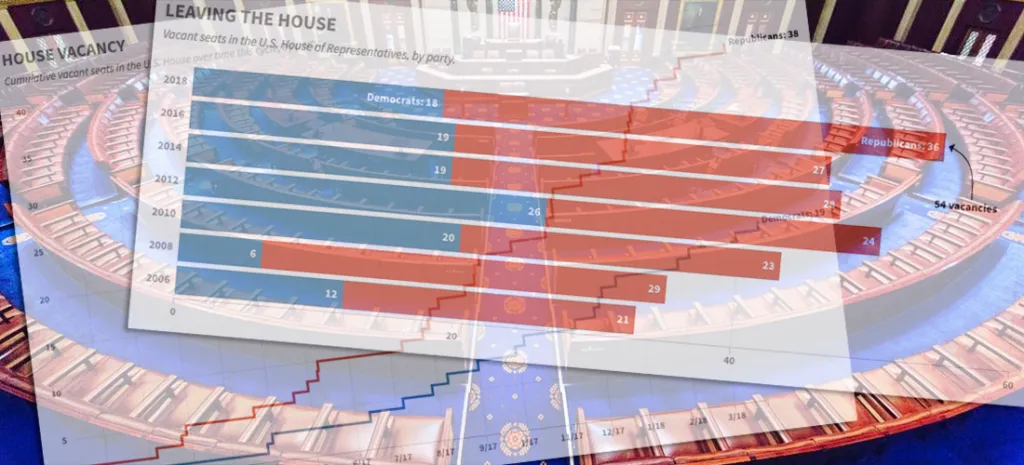
Charting the GOP's Congressional Exodus
Another Republican in the U.S. House — Speaker Paul Ryan, no less — announced his intention not to seek re-election in 2018, adding to the number of members leaving ahead of what's...
Read more →
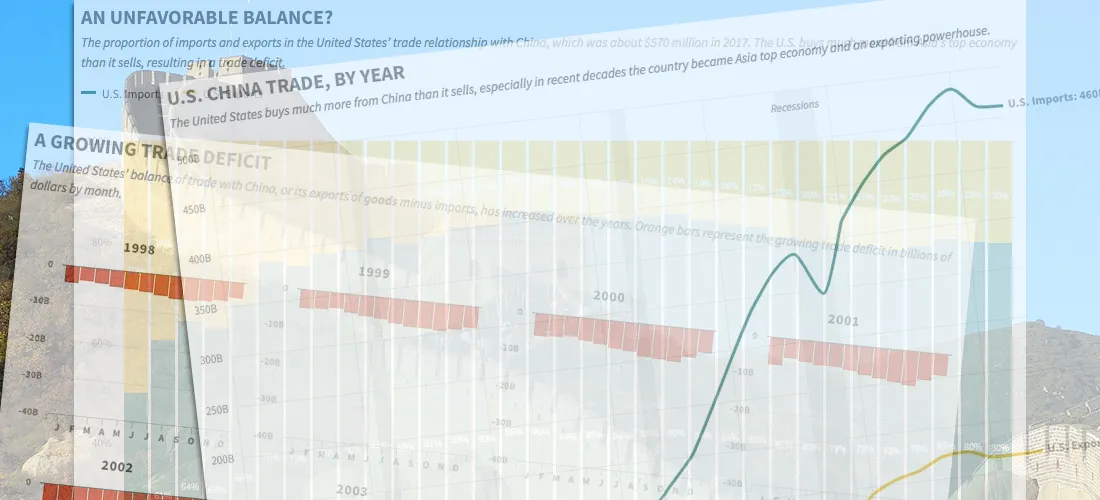
China's Imbalanced Trade with the United States, in Four Charts
A trade war could be looming between the United States and China, fueled by President Trump's fixation on the two nations' unbalanced import-export relationship. The trade imbalance between the two...
Read more →

Chart: Republican Attacks on the FBI Have Worked, Especially on Republicans
HuffPost is out with an interesting poll about the the public's trust in the FBI, which has been under attack recently for its role in the investigations of Hillary Clinton...
Read more →
How Do We Solve North Korea? Yonsei University Students Have Ideas.
I gave a guest lecture today to an East Asian international relations course at Yonsei University in Seoul. As part of the class, the more than 40 students participated in...
Read more →
Assessing Global Health in Four Key Diseases
While reporting on South Korea's high suicide mortality rate recently, I discovered an unique data set maintained by the World Health Organization. It contains the probability that residents in each...
Read more →

Testing ai2html on a North Korean Defector
A few weeks ago I wrote about the daring defection — and eventual rescue — of a North Korean soldier who barreled across the Demilitarized Zone in a truck and...
Read more →

North Korean 'Provocations' Freeze During Winter?
Last week I posted a visual timeline highlighting nuclear, missile and other "provocations" by the North Korean regime since 2006. The data show a clear escalation, especially in missile tests,...
Read more →

Before/After Imagery: American Military Base in South Korea Dramatically Expands
When President Trump came to South Korea earlier this month, he spoke to troops at the U.S. Army garrison known as Camp Humphreys — 40 miles south of Seoul — rather...
Read more →

Visualizing South Korea's Assailed Trade Relationship With The U.S.
President Trump isn't happy with the United States' bilateral trade agreement with South Korea. His main concern, it seems, is that the United States has suffered a "trade deficit". That...
Read more →
Visualizing North Korea's Missile Launches
Despite international objections, North Korea has launched four ballistic missiles in the last week, including one that flew over Japan, raising regional tensions about the rogue state's weapons development even...
Read more →
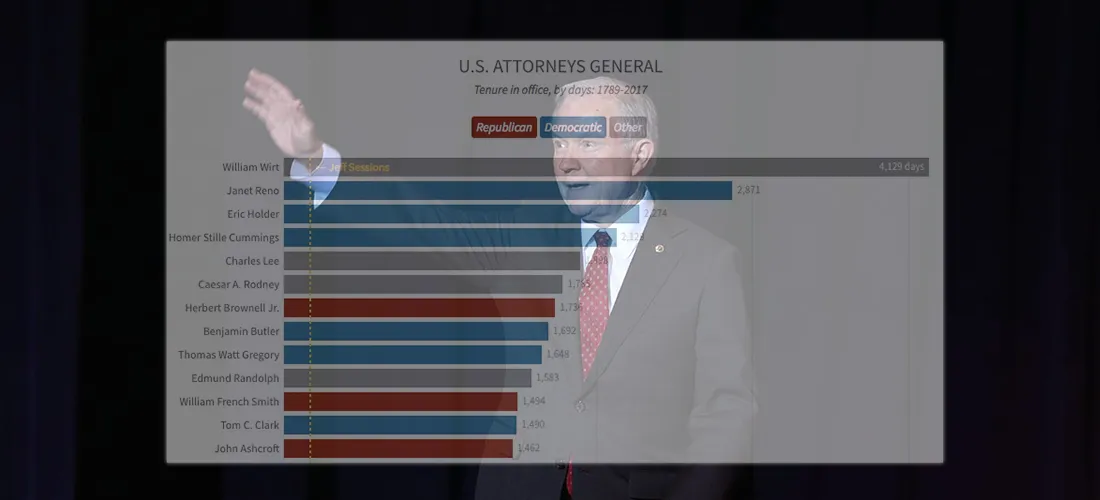
Chart: If Ousted, Jeff Sessions Would Have a Historically Short Tenure
If President Trump decides after all to replace Attorney General Jeff Sessions, who was approved just 166 days ago, the former Alabama senator would have one of the shortest tenures...
Read more →
Mapping Opposition to the GOP Health Care Bill by Congressional District
The legislative failure of the GOP's replacement for Obamacare has been widely reported, obviously, but I remain interested in one bit of polling noted this week by FiveThirtyEight. The polling...
Read more →

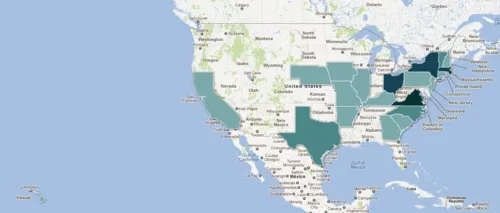
Maps: Where Are America's Alternative Fuel Stations?
I recently stumbled upon the U.S. Department of Energy's alternative fuels data center, a clearinghouse for information on transportation technology. Inside there's a handy station locator tool allowing users to...
Read more →
Charting Historical Voter Turnout
As FiveThirtyEight notes, turnout in the 2016 presidential election isn't dramatically lower than it was four years ago, according to the latest estimates. And with many mail-in and provision ballots...
Read more →
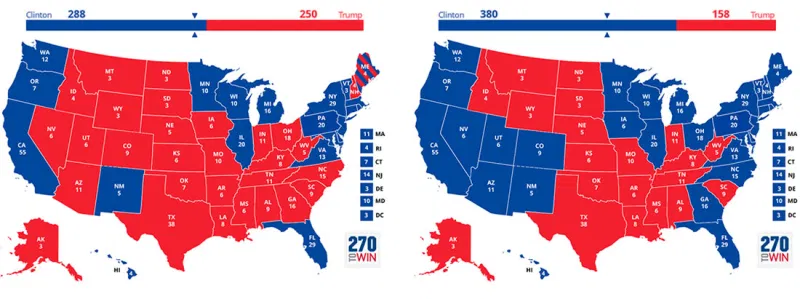
FiveThirtyEight Chat On Maps: Turning The "Big" States Blue
The folks at FiveThirtyEight had a fun data visualization discussion during their regular election chat this week, about whether Hillary Clinton should focus on ensuring victory next month or spending...
Read more →
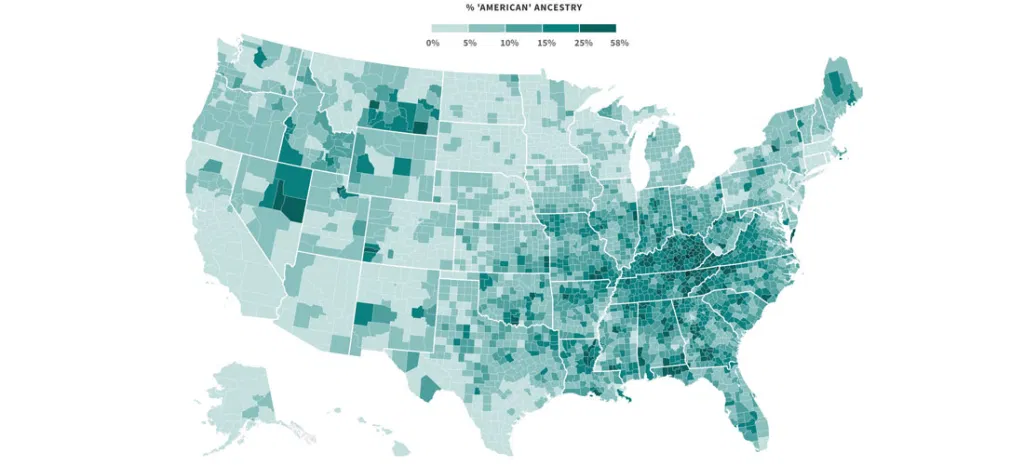
Mapping Where 'Americans' Live
Back during the Republican primaries, The Upshot published an interesting short post called the Geography of Trumpism. The reporters back then analyzed hundreds of demographic variables, by county, in an...
Read more →
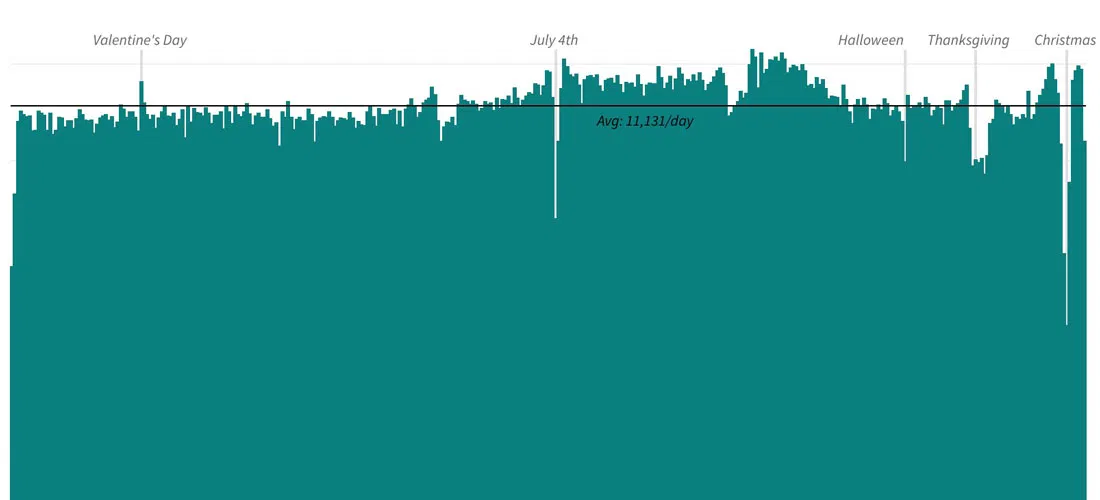
Charting American Birthdays: Yours Probably Isn't That Special
Last week I published a new heatmap exploring the popularity of American birthdays. The chart, which uses darker shades to represent higher average birth counts on specific days, can give...
Read more →
Is South Korea's National Assembly More Liberal Than South Koreans?
Members of South Korea's legislative branch, known as the National Assembly, recently took a poll to determine where they land on the ideological spectrum. The group as a whole appears...
Read more →
How Immigration is Animating the 'Brexit' Vote, in Four Charts
Immigration to the United Kingdom has risen sharply in recent years, and it's fueling the debate about Britain's looming "Brexit" vote on whether to leave the European Union. Many supporters...
Read more →

Let's Tess(t)ellate: The Electoral College in Tile Grid Maps, 1980-2012
I recently added some new charting tools here thanks to NPR's excellent daily graphics rig, which we used recently to compare air quality in Seoul with other large cities. There's...
Read more →
Mapping Clinton, Trump Support
I've been collecting county-level data on the presidential primary race since the contests began earlier this year. With Donald Trump now the Republicans' presumptive nominee — and Hillary Clinton rapidly...
Read more →
Charting the Popularity of 'Hillary'
Despite her big win in New York, trouble looms for Hillary Clinton in the general election, according to a new poll that shows her favorable/unfavorable ratings at dangerously low levels...
Read more →
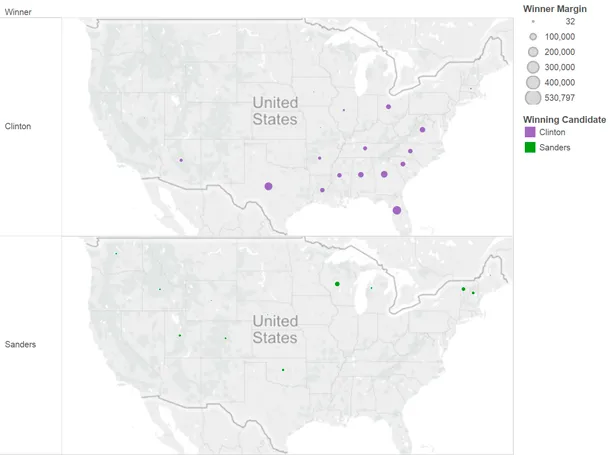
Charting Clinton's Sizable Lead in Votes
This post has been updated. See correction at the bottom of the page. To some Bernie Sanders supporters, the Democratic presidential race must seem close. Their candidate, after all, has...
Read more →
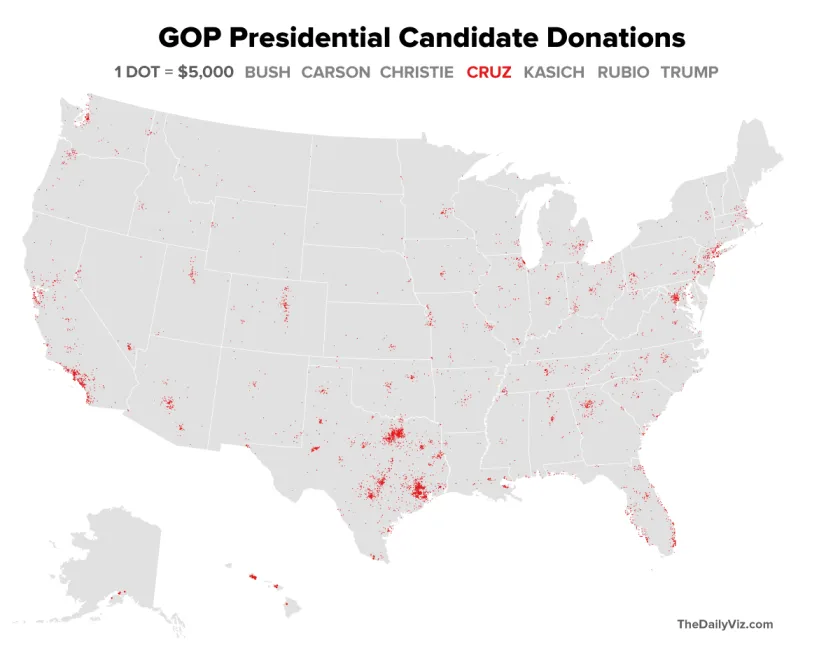
Mapping GOP Campaign Cash by Density
The GOP presidential candidates collectively have raised more than $300 million in this election cycle, according to Federal Election Commission data. Here's a quick look at where several of those candidates...
Read more →
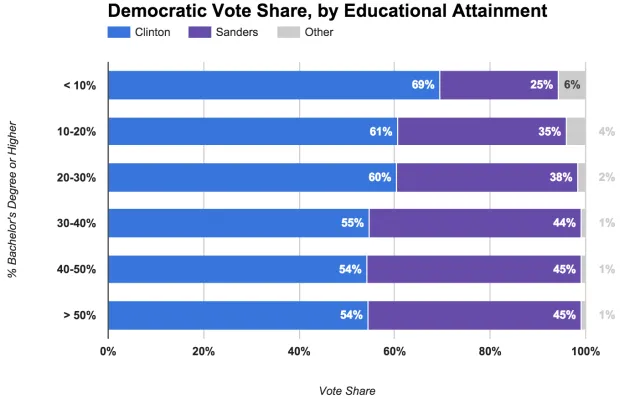
Sanders Strongest in Educated Areas
Last week we examined how the Democratic presidential campaigns have performed in the context of Barack Obama's 2012 re-election. That analysis grouped Obama's vote share into categories, highlighting how the country's...
Read more →
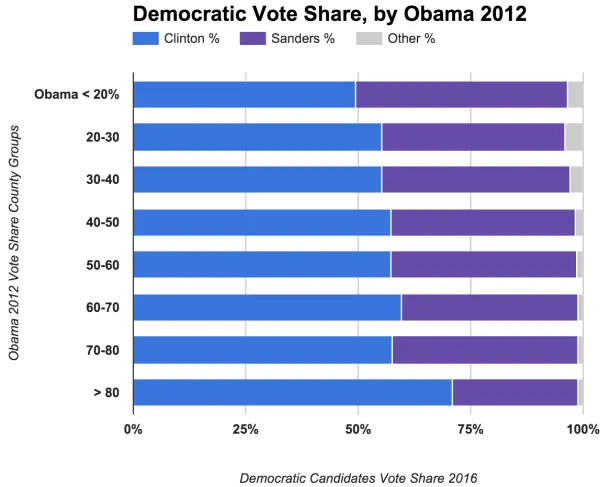
Comparing Clinton, Sanders Vote Share with Obama 2012
Among the fascinating aspects of American politics are the various factors — demographic, financial, historical, etc. — that shape the geography of campaigns. This election cycle is no different, with...
Read more →

The Nation's Most Consistently Partisan Counties In Presidential Elections
When it comes to recent presidential elections, geography — at least in some stubborn places — is destiny. Voters in more than 1,600 American counties — a little more than half of...
Read more →
Mapping Consistently Partisan Counties
When it comes to recent presidential elections, geography — at least in some stubborn places — is destiny. Voters in more than 1,600 American counties — a little more than half of...
Read more →
Clinton Dominates 'Majority Minority' Counties
Hillary Clinton's efforts to win over minority voters have paid off significantly in the Democratic primaries. Many of these voters simply aren't feeling the Bern, according to voting results and demographics...
Read more →
Where 'Anglos' are the Minority
I've posted before about "majority minority" counties — places where non-Hispanic whites represent less than half the population. They were critical to President Obama's election in 2008, and their numbers...
Read more →
"Bernie Baby" and the Decline of Sudden Infant Death Syndrome
"Bernie Baby," a Los Angeles infant who gained attention on social media after his mother dressed him like Democratic presidential candidate Bernie Sanders, has died, the Associated Press reports. The...
Read more →
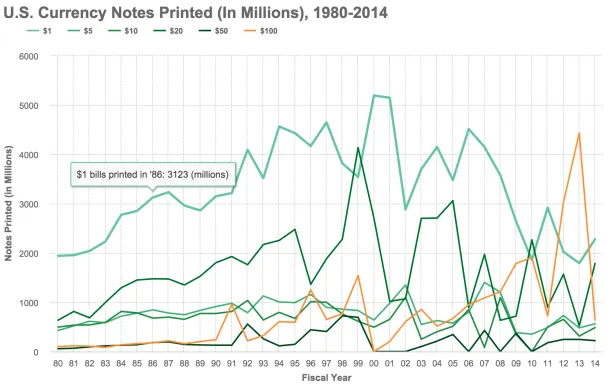
Charting Billions of (Endangered?) $100 Bills
The ubiquitous $100 currency note — the Bill, the C-Note, the Benjamin — might be ready to cash out, at least if a group of influential economists have their way. In a...
Read more →
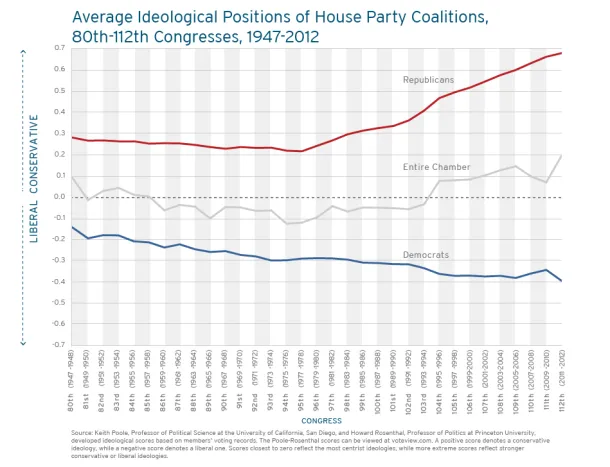
Charting Partisan Polarization in Congress
The Fix today has a post about the newly released digital version of Vital Statistics on Congress, a partnership between between a few think tanks that contains reams of enlightening...
Read more →
Mapping 'Majority Minority' Presidential Results
Yesterday I mapped the more than 350 "majority minority" counties in the United States, breaking them down by race and ethnicity groups and geography. As promised, today I've looked at how...
Read more →

Charting Inaugural Speech Lengths
President Obama began his second term today with a roughly 2,000 word inaugural speech at the Capitol. How does the length of his remarks compare with other presidents in history?...
Read more →
Charting Views On The 'Fiscal Cliff'
The Washington Post charts the results of its new poll: In addressing the fiscal cliff, the public supports increasing taxes on the wealthy but have mixed views of changing federal...
Read more →
Mapping Obama's Election Performance By County In 2012 Vs. 2008
The Washington Post over the weekend published an interesting story about President Obama's southern support in the election: The nation’s first black president finished more strongly in the region than...
Read more →
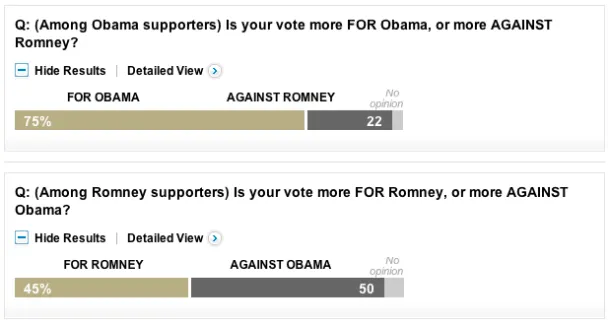
Charting Presidential Voting Motives
These two charts from the latest Washington Post poll are interesting. They show what's motivating likely voters in the presidential race. President Obama's supporters are largely voting for him. Mitt...
Read more →
Analyzing Convention Speeches
The New York Times created two nifty interactive bubble charts to represent the frequency of words used at the respective political conventions. First, the Republicans: And the Democrats (so far):...
Read more →
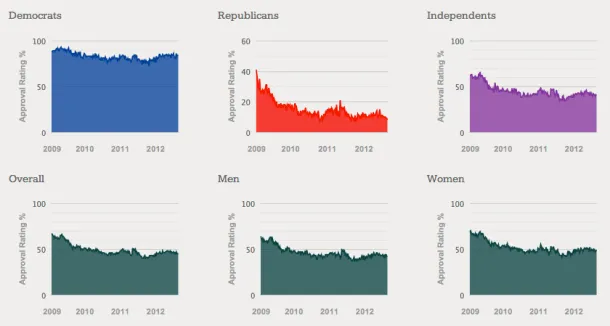
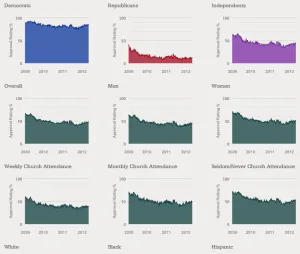
Obama Approval Rating Charts Updated
A few months ago I posted a dashboard of 21 interactive charts comparing President Obama's approval rating among different groups (men vs. women, Democrats vs. Republicans, rich vs. poor, etc.)....
Read more →
Mapping VP Birthplaces
If elected, Republican Paul Ryan would be the first vice president from Wisconsin. Here's where the 47 men who've held the office were born, according to data on Wikipedia: Download...
Read more →
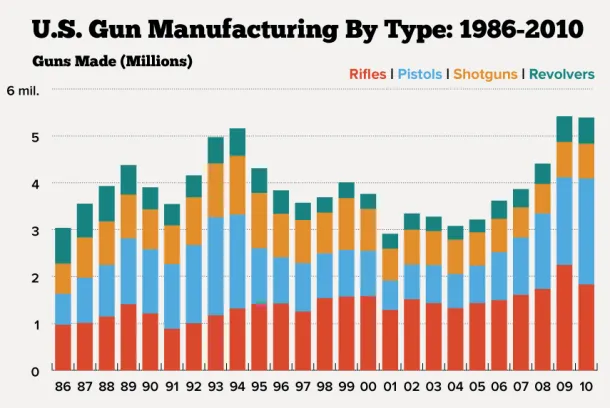
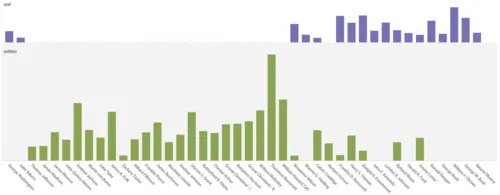
Charting U.S. Gun Manufacturing
More than 5 million guns were made in the United States in 2010, according to the latest data available from the U.S. Bureau of Alcohol, Tobacco, Firearms and Explosives, among...
Read more →
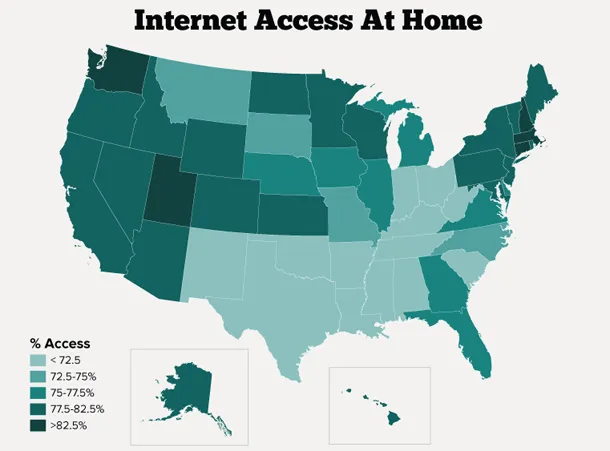
Mapping Internet Access In U.S. Homes
About three quarters of Americans have access to the Internet at home, according to a new survey released this week by the U.S. Census Bureau. New Hampshire, Washington and Utah...
Read more →
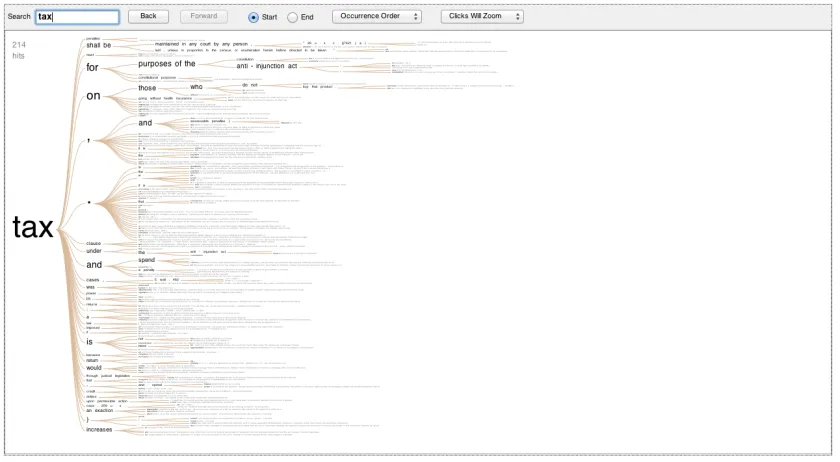
The Health Care Ruling as a 'Word Tree'
As everyone knows by now, the U.S. Supreme Court today essentially upheld the Affordable Care Act, also known as Obamacare. I created a word tree to find specific words in...
Read more →
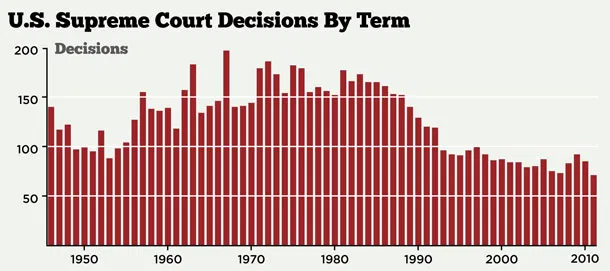
Charting SCOTUS Decisions Over Time
The U.S. Supreme Court is expected to release rulings on key cases over the next week, including the much-awaited decision on the Affordable Care Act. The court has seen its...
Read more →
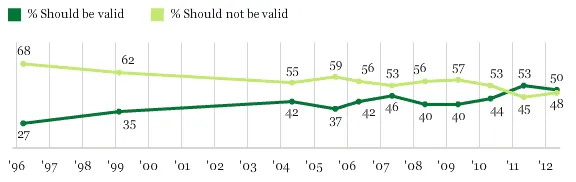
Charting Attitudes About Gay Marriage
President Obama said today that same-sex couples should be allowed to marry. Half of Americans agree, according to Gallup:
Read more →
Charting Border Agents, Apprehensions
The U.S. Border Patrol told Congress on Tuesday that the number of apprehensions along the Mexican border was at a 40-year low. The trend prompted the agency to propose a...
Read more →
Comparing President Obama's Job Approval Rates Among Different American Groups
President Obama's approval rating has crept just above 50 percent, his best position in a year, the latest Gallup survey figures show. The Washington Examiner adds some historical context: Obama's numbers...
Read more →
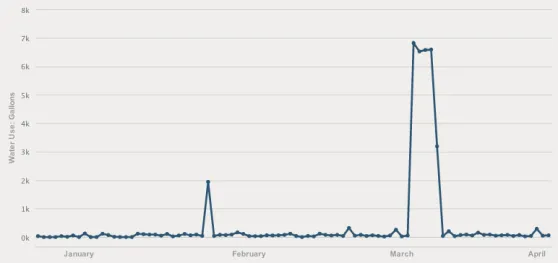
Charting Our Nightmare Water Bill
The folks at DC Water have had trouble updating our account since we closed on a new house in January. They figured it out recently, though, and we got a...
Read more →
Charting Post Offices
The U.S. Postal Service is still struggling to compete in an era of declining paper mail, and as private industry and Congress have resisted its efforts to reform, according to...
Read more →
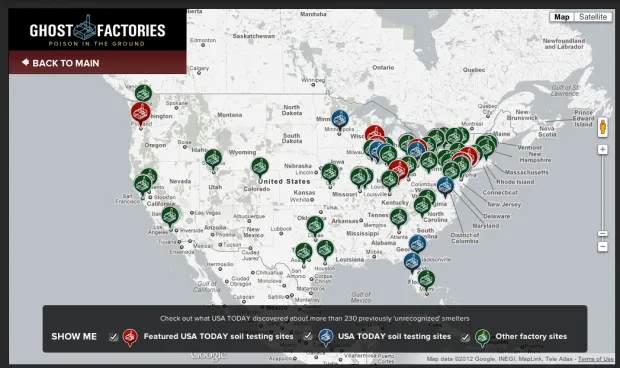
Uncovering 'Ghost Factories'
USA Today has a terrific package today about neighborhoods across the country that could have dangerous levels of lead contamination from old factories: Despite warnings, federal and state officials repeatedly...
Read more →
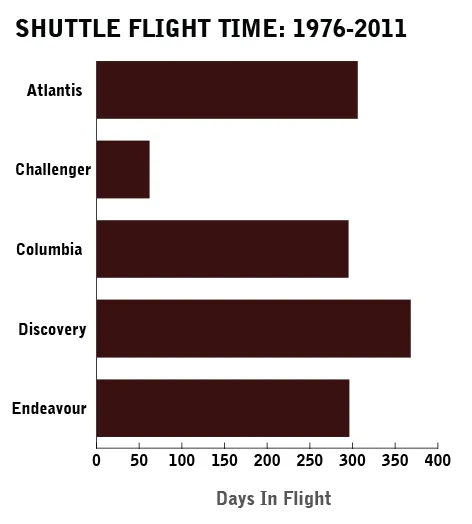
Charting Space Shuttle Mission Lengths
NASA flew more than 130 space shuttle missions since the vehicle went into orbital use in the early 1980s, and today the agency wowed many in D.C. with a landing at Dulles...
Read more →
Googling the GOP
A look at the GOP race through Google searches:
UPDATE: Ron Paul included at disobey’s request:
Read more →
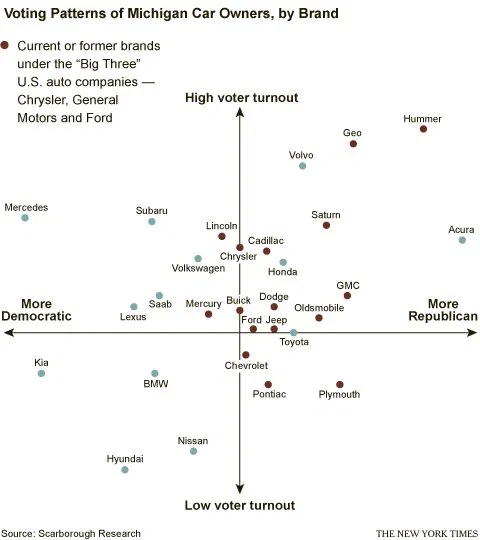
What Car Brands Tell Us About Our Political Participation
Interesting… When it comes to cars, the results are often predictable. It probably won’t surprise anyone to learn that the data, as collected by Scarborough Research, show that drivers of...
Read more →
Mapping the Birthplaces of U.S. Presidents
Since I get the day off, I figured I should repay our presidents by honoring their birthplaces with two maps made with Google Fusion Tables. This first map places points...
Read more →
Did Obama Neglect Health Care in State of the Union Speech?
More analysis from the speech from The Advisory Board Company: Obama’s speech included just 44 words on health reform, far fewer than in his previous addresses. He said that the makeup...
Read more →
Obama's State of the Union
The Washington Post does a nice job comparing this year’s State of the Union to President Obama’s previous annual speeches: President Obama devoted nearly half of his fourth annual address...
Read more →
How 'State of the Union' Speeches Changed Over Time
Tonight President Obama gives his third “State of the Union” speech, an address that dates back to George Washington. Over time, the length and format of the speech has changed,...
Read more →
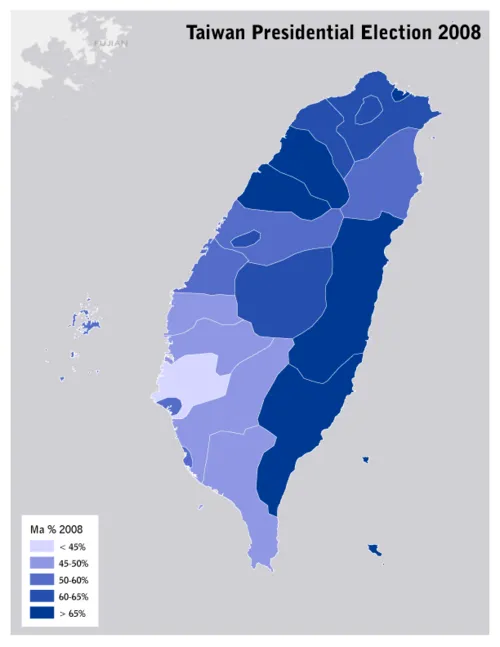
Ahead of Vote, Mapping Taiwan's Presidential Election in 2008
While we watch the GOP candidates vie for their party’s nomination, the Taiwanese (including some of my wife’s family) are voting in presidential elections of their own — a race that could...
Read more →
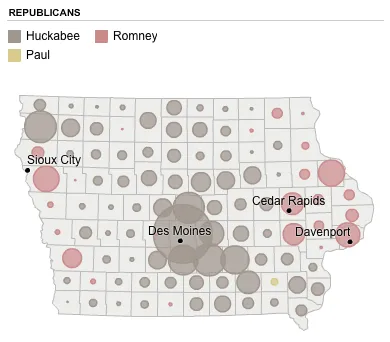
2008 Iowa Caucus Results
These maps, created by The New York Times four years ago to visualize the Republican results, might be interesting for reference as the returns come in tonight. Mitt Romney, who lost...
Read more →
President Obama's Approval Ratings At Five-Month High
Better news for the president? Perhaps, according to USA Today: Obama’s approval ratings are higher than his disapproval ratings for the first time since July, according to the latest Gallup...
Read more →
Charting Days Members of Congress Spend in 'Session'
Time is winding down on another year of congressional business. How much time have representatives and senators worked this year compared to the past? Senators, on average, were in session...
Read more →
Charting War Fatalities
The Washington Post this morning reports on Army Spec. David Hickman, who died last month in Bagdad, the victim of a roadside bomb. The paper notes that Hickman could very...
Read more →
Cain Out. Perry Down.
Back in October I posted line charts illustrating Herman Cain’s rise in popularity among GOP — and Texas Gov. Rick Perry’s descent after some unsteady debate performances. Yesterday Google released...
Read more →
Visualize Congressional Words
The Sunlight Foundation this week released a new-and-improved service that allows users to compare words uttered by members of the U.S. Congress: For every day Congress is in session, Capitol...
Read more →
Mapping the New York Senate Same-Sex Marriage Vote
As we all know, the New York Senate on Friday voted to approve same-sex marriages. These maps, made with ArcGIS, visualize the districts by vote, seniority and political party. First,...
Read more →